


1. INTRODUCTION
The causes of artifact discoloration are diverse, and are typically attributed to light, temperature, humidity, and atmospheric conditions. In particular, the effects of light are significant, and the degree of discoloration due to light varies depending on the composition of the artifact. Most previous Korean studies measured the degree of deterioration via illuminance, which is the main factor of lighting that affects material deterioration. However, due to the characteristics of light emitting diode(LED) sources that emit light by combining the photons of the LEDs, the energy is affected by the degree of interference the short wavelength region. Therefore, to investigate material deterioration, the total radiation flux value has become more important compared to the light source with a constant spectrum like halogen lamp.
LED color temperature(Monico et al., 2013;Zhai et al., 2015) and effective wavelength(Lunz et al., 2017) have been studied as factors affecting artifact discoloration, mainly in foreign oil paintings. In Korea, research on the effects of discoloration has been conducted on traditional adhesives and pigments(animal glue and orpiment), where LED light sources have a greater effect on total radiation flux than the illuminance of the light source(Kim et al., 2018;Jo et al., 2019). However, there is insufficient research to verify this assumption.
Therefore, an accelerated deterioration experiment using an LED source was conducted on fabric and paper as support materials for artifacts, while blue wool standard was used for objective evaluation. Two types of LED sources were used in the deterioration experiments to analyze discoloration/fading trends, and basic standardization of the degeneration conditions for Korean artifact materials was performed.
2. EXPERIMENTAL METHODS
The discoloration reactions for under two types of light sources were investigated for representative light-sensitive materials. Paper and textile, which are organic materials used as supports for traditional painting artifacts, were selected as representative materials and deterioration experiments were performed under two types of LED lighting sources with different characteristics. For the colored Hanji(Korean traditional paper) samples and dyed silk fabric samples, the stabilities of the coated pigments and dyes were also tested.
2.1. Samples for the accelerated deterioration experiment
2.1.1. Hanji samples
The materials used in this experiment were purchased from Mungyeong Hanji(Gyeongsangbuk Province), from where the raw material constituting Hanji-paper mulberry was obtained. A traditional Hanji manufacturing technique was used. By distinguishing the basis weights for different purported uses, two types were utilized herein: Hanji for Korean paintings(35 g/m2) and Hanji for the duplicates of the Annals of the Joseon Dynasty(60 g/m2; Table 1).
2.1.2. Textiles samples
Undyed samples
Silk fabric and hemp are traditional textiles commonly found in excavated cultural properties. They were used as representatives materials for light-sensitive artifacts. Silk fabric can be classified into two types(raw silk for painting and processed silk) depending on the use and composition. Raw silk for painting is the most common raw silk textile used in painting supports. It contains abundant sericin. Processed silk(hereafter referred to as silk) is most commonly found as soured silk textile in excavated textile artifacts, consisting mostly of fibroin(Kim, 2003).
For hemp, Andong hemp woven in Andong using Korean cultivars was utilized.
For each of the samples, the materials were obtained from fabric stores, where the raw materials and import sources were identified, after consultation with the traditional textile class of the Korea National University of Cultural Heritage(Table 1).
Dyed samples
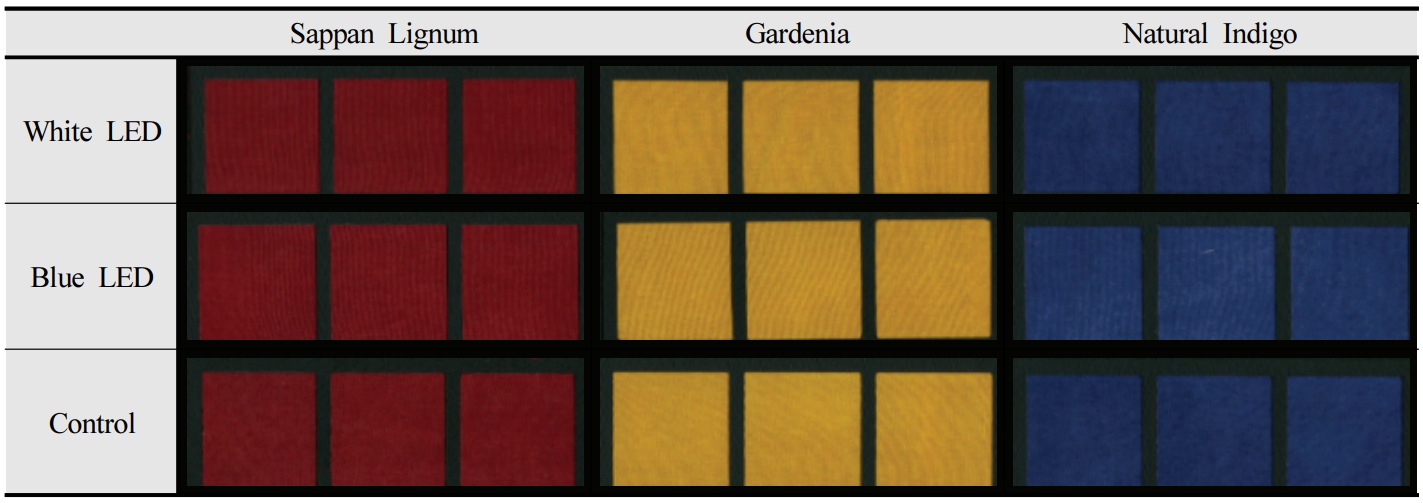
For the dyed samples used herein, naturally dyed silk used in clothing was sourced and the silk fabric(Sangju Hamchang Silk) was dyed five times. Three colors that are commonly found in traditional clothing were selected: red, yellow, and blue. The dye materials were as follows: Sappan Lignum for red; Gardenia for yellow; and Natural Indigo for blue. Each color had a different fastness to light(Table 1).
2.2. Blue wool standard
The blue wool standard is a methods that indicates the scale of deterioration by light. It is the standard used in ISO105-B08 in Europe and AATCC in the United States.
Herein, the fabric samples were exposed to an artificial light source under controlled conditions, along with a set of blue wool standards. Subsequently, the color fastness was evaluated by comparing the discoloration/fading degree in the reference material(blue wool standard) and the sample. The method was based on the Korean Industrial Standard(KS K ISO 105-B02). For an objective examination of the degree of deterioration, the standard was attached to a sample for each experiment condition(Table 1).
2.3. Experiment and evaluation
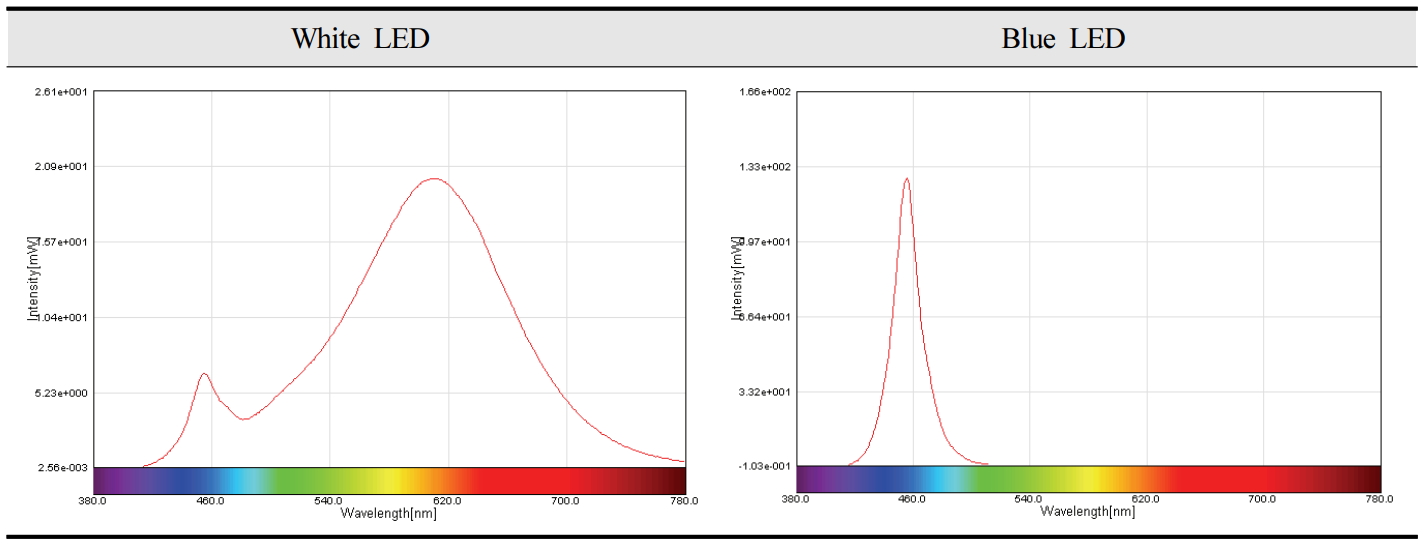
The experiment was performed at a distance of 175 mm using an independently developed accelerated aging apparatus and two commercially available lighting(white LED and blue LED with amplified short wavelength). Each chamber interior was manufactured in a dark room so that it was unaffected by an external light source during the experiment. The experiment was performed over 60 days, and the temperature and humidity of the chamber containing the sample were confirmed using a thermo-hygrograph(Testo 174h, TESTO, DEU; Table 2). After the accelerated deterioration experiment was complete, the discoloration degree in each sample was evaluated by measuring the color difference before and after irradiation. For chromaticity, a five-point measurement was performed using a color meter(CR-400, MINOLTA, JPN) based on KS M ISO 5631-1(D65/100┬░, 5-point measurement). The light source conditions of the lighting used herein are described in Table 3 and Figure 1.
3. RESULTS
3.1. Hanji Samples
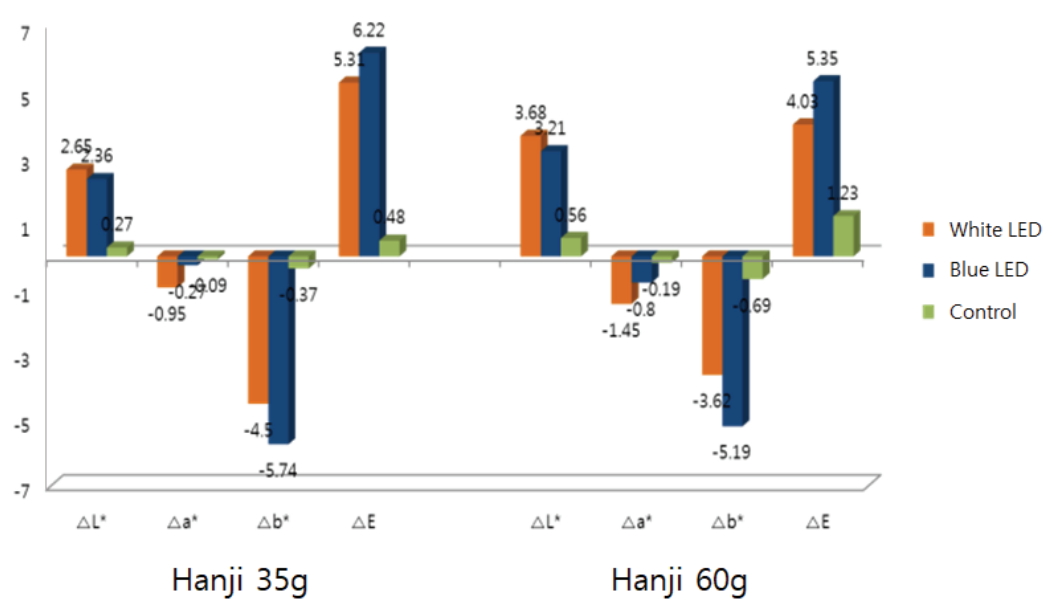
After the accelerated deterioration experiment using the white and blue LEDs, the Hanji samples showed a significant discoloration pattern(Figure 2). In the experiments using the white LED, ΔE(ΔE = [(ΔL*)2 + (Δa*)2 + (Δb*)2]1/2) values of the 35 and 60 g/m2 of Hanji were 5.31 and 4.03, respectively. Under the blue LED, the ΔE of 35 and 60 g/m2 of Hanji samples were 6.22 and 5.35, respectively. Thus, the discoloration degree varied depending on the basis weight. When each data point was examined, the variation of Δb* was the largest in the (-) direction under both lighting conditions, while the change in chromaticity was larger under the blue LED(Figure 3).
3.2. Textile samples
3.2.1. Undyed samples
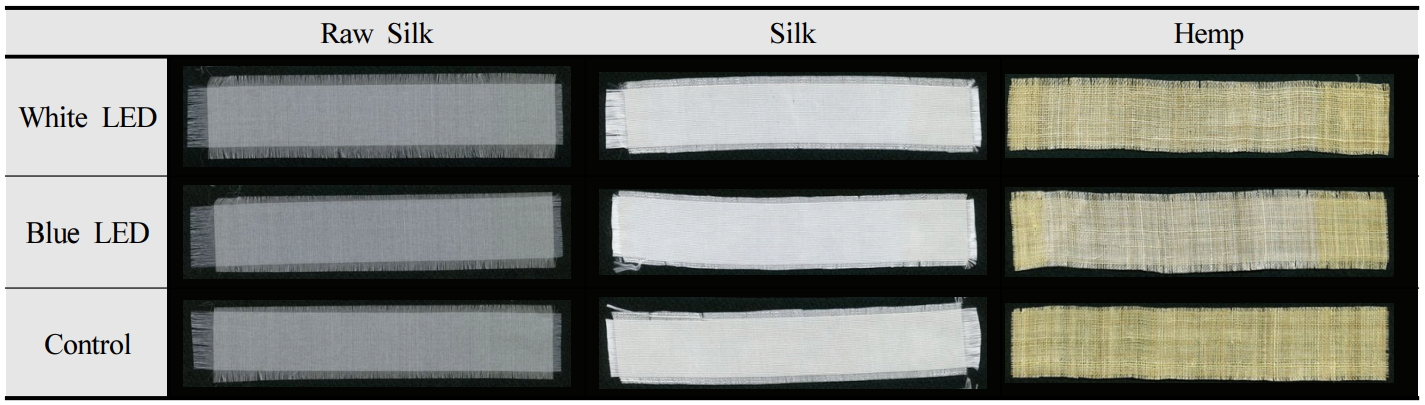
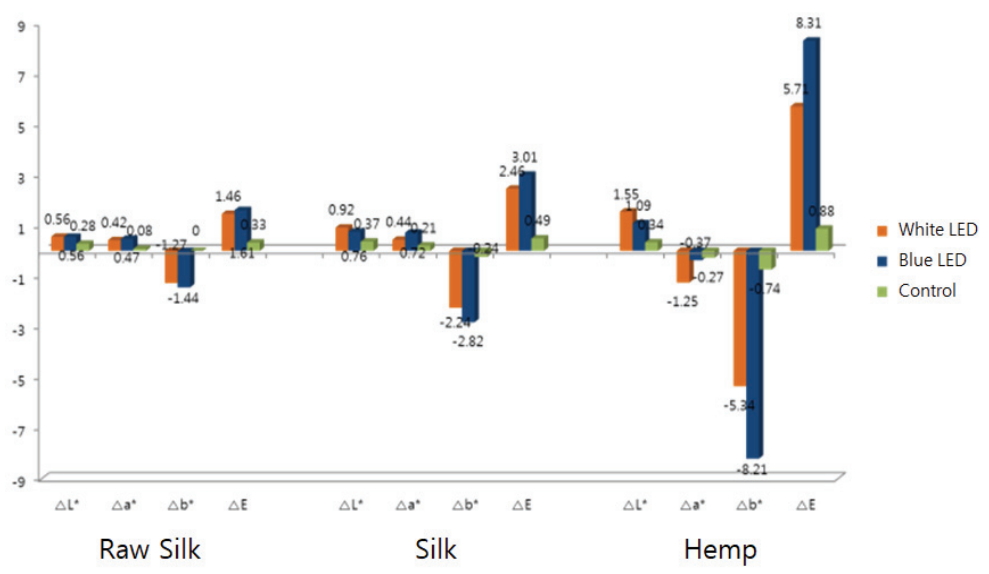
Hemp showed the most significant discoloration patterns of all the textiles tested herein(Figure 4). Of the raw silk for painting, silk, and hemp, the changes in chromaticity were larger under the blue LED compared to the white LED. In addition, the silk discoloration pattern was larger than that observed for raw silk. For all samples, variations in Δb* were the largest in the (-) direction under, both light source conditions. However, the variation in Δa* was only -1.25 when for hemp under the white LED(Figure 5).
3.2.2. Dyed samples
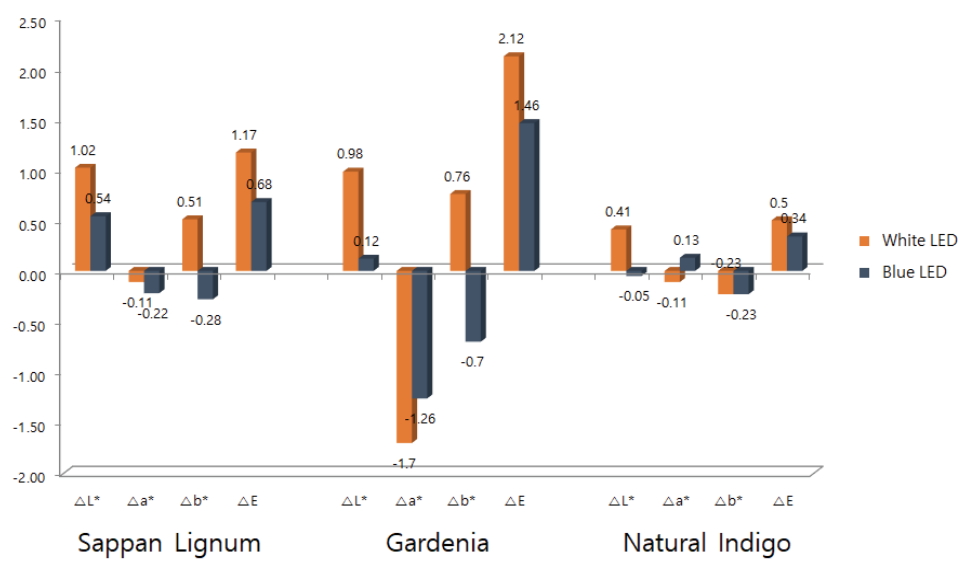
For the dyed silk samples, the chromaticity changes were larger under the white LED(Figure 6). The ΔE of Natural Indigo was the smallest, while the discoloration degree of Gardenia was the most distinct. In addition, under the white LED, Δb* was in the (+) direction for Sappan Lignum and Gardenia and the (-) direction for Natural Indigo. Under the blue LED, Δa* was in the (-) direction for Sappan Lignum and Gardenia and the (+) direction for Natural Indigo. Thus, opposite trends were observed depending on the dye color(Figure 7).
3.2.3. Blue wool standard
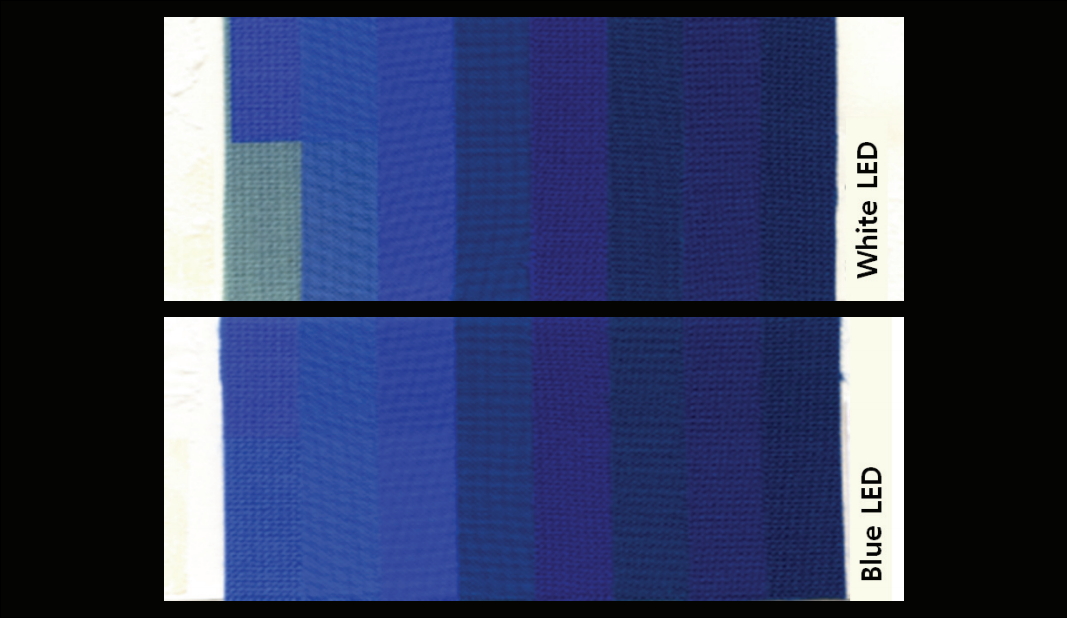
After the accelerated deterioration experiment under the white and blue LEDs, the blue wool standard showed contrasting discoloration patterns. Under the white LED, significant changes were observed with the naked eye, up to Stage 3, whereas under the blue LED, only Stage 1 changes were observed(Figure 8).
4. DISCUSSION
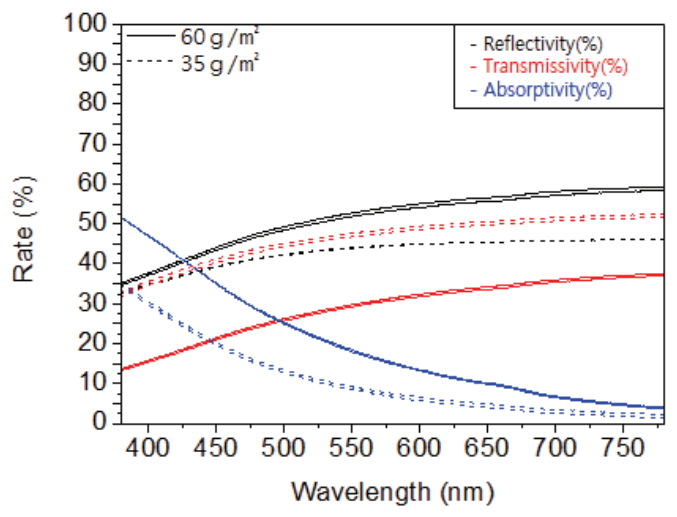
For Hanji, the absorption rate was high in the blue region where the energy per photon is high, while the absorption rate is low in the red region. The blue LED light source contained high light energy in the blue region, where the absorption rate of Hanji is high, and thus the deterioration under this light source was higher. The difference in the deterioration degree depending on the basis weight of Hanji was assumed to be due to it thickness. The average thickness of Hanji with 35 g/m2 basis was 97.8 ╬╝m, while that of 60 g/m2 Hanji was 152.6 ╬╝m, a difference of approximately 1.6 times(Figure 9).
To verify this assumption, the transmittance of the two basis weights materials were measured in the visible light region by using the ŌĆ£ŌĆśMeasurement of reflectivity, transmissivity and absorptivity(CARY 5000, Agilent technologies, USA)ŌĆÖmethodŌĆØ. The transmittance(red line) was approximately 20% highter for the 35 g/m2 Hanji compared to its 60 g/m2 counterpart. Therefore, the light irradiation penetrated the lower density Hanji to a greater extents, resulting in a more pronounced color difference.
The discoloration reactions in the raw silk for painting and regular silk were likely due to photolysis. Silk textiles are composed of amino acids including phenylalanine, tryptophan, and tyrosine, which are known to undergo photo-oxidation. Photolysis may destroy the peptide bonds(-CONH-) within fibroin or induce cross-linked bonds between polymer chains. Therefore, if the raw silk for painting, which contains sericin, and the silk, which is a scoured silk textile consisting mostly of fibroin, were compared, the degree of discoloration should be higher for the silk.
The apparent discoloration of hemp over raw silk and silk organized animal fibers is likely due to the lignin component of hemp, which is a vegetable fiber. It is known that ŌĆśligninŌĆÖ, which is the main constituent of hemp, is extremely unstable during deterioration, and the color stability of paper containing large amounts of lignin is relatively low(Choi et al., 2014).
For the dyed silk sample, a larger change in chromaticity was observed for the white LED and unlike the other samples, the ΔL* value was larger. In CIE L*a*b*, The L value represents lightness on a scale ranging from black(0) to white(100), so the lightness decreases as deterioration progresses. Differences in this value between light source color were not observed in the dyed sample because of the inherent light resistance of the dye. Therefore, it is necessary to study dyes of various colors to properly investigate fastness.
After performing the accelerated deterioration experiment using the two light sources, the discoloration pattern of the blue wool standard showed contrasting results. Under the white LED, discoloration up to Stage 3 was observed, whereas the blue LED with amplified short wavelength(blue region) induced, discoloration only up to Stage 1. This is contrary to the results for paper and textile likely the blue wool standard reflected the blue region light during the accelerated aging experiment. Therefore, deterioration was relatively insignificant when compared to those observed for the paper and textile samples.
The results presented herein indicate that the effect of the light source on the target object aging in the accelerated deterioration experiment is mainly related to the total radiation flux(mW), instead of the total luminous flux(lm), which was previously suggested as the main cause of aging. Short wavelengths(blue color) have higher energies per photon, according to Q = hc/╬╗(wavelength), inducing aging accordingly. Therefore, it is assumed that the wavelength of the light source has an influence that depends on the inherent color of the object or material constituting an artifact.
Similar results were reviewed to understand the impact of these differences on pigment stability, and foreign studies have shown the wavelength dependence of pigment discoloration(Lunz et al., 2017). Contrary to the expectation that lower wavelength photons would induce more damage, UV(394 nm), blue, and cyan light resulted in similar levels of pigment discoloration at the same level of radiant power. This indicates that by understanding this wavelength dependence, it is possible to minimize degradation.
5. CONCLUSION
To examine the effects of two LED lighting types with different wavelengths on artifacts composed of various materials, an accelerated aging experiment was conducted.
The accelerated aging experiment showed that the degree of discoloration varied depending on the sample color, likely because the light reflection and absorption wavelength bands of each material differed. The deterioration degree of the material was dependent on the characteristic color of the substance. The deterioration dependence on wavelength was closely related to material color. Discoloration was more significant with high energy light sources at low illuminance was due to the influence of the total radiation flux(mw). This is in contrast to previous studies that indicated relic deterioration was due to total luminous flux(lm).
The materials used herein were limited to organic materials, so further detailed experimental verifications under diverse conditions are necessary. However, the effect of the light source conditions on the artifact materials was thoroughly examined, and it is expected that the results will be useful to guide further research on discoloration/fading.