An Analytical Investigation on the Dancheong Pigments by Hyperspectral Technique: Focusing on Green Colors
Article information
Abstract
This study demonstrates the application of hyperspectral analysis as a pigment identification method for modern and contemporary Dancheong, the polychrome surface on traditional Korean wooden buildings. In particular, green pigments are the focus of this study. Green pigments in modern and contemporary Dancheong have the largest variation of materials and show a noticeable timeline. Thus, they are most suitable for estimating the manufacture or restoration period of Dancheong. Hyperspectral analysis is a noncontact, long-distance measurement technique that has advantages in the field of Dancheong analysis. It is capable of identifying both organic and inorganic pigments, unlike existing analysis methods. For this experiment, green and other pigments used during the modern and contemporary era were selected and made into painted samples under various mixing conditions that reflect their actual uses. Through hyperspectral analysis, their reflectance characteristics were observed, which enables the derivation of four main features that can distinguish the type of pigments used for color mixture. Based on these, a pigment identification system was designed in the form of a flowchart, and its utility was confirmed through site application. Despite some limitations at this stage, the technique can be complemented by considering proper measurement methods or the continuous accumulation of samples and data. If a database on various materials, mixing ratios, painting techniques, and other external interference factors is developed in future research, it would provide the foundation for a faster and safer analysis environment of Dancheong sites.
1. INTRODUCTION
Dancheong refers to the polychrome surface on traditional wooden buildings in Korea. Traditionally, inorganic mineral pigments and certain natural organic pigments are mainly used in Dancheong(Hong and Jung, 1992;Cho et al., 2001;Jang et al., 2010;Hong and Lee, 2013;Han et al., 2014;Ha, 2015;Kim, 2015;Ji, 2017;Song, 2018). However, since around the 19th century, industrially produced synthetic pigments, such as emerald green or ultramarine blue, were introduced and used in Dancheong. Since around the 1970s, new synthetic organic pigments were also introduced and used for Dancheong(Bureau of Cultural Property, 1972;Jang and Han, 1993; Jeon, 2005;Moon, 2010;Byun, 2014;Oh et al., 2015). Green colors in Dancheong best represent this historic change in material and have the largest variation in color-mixing recipes. Thus, green pigments can help in estimating manufactured or restored periods. Current scientific analysis methods carried out for Dancheong mainly require direct contact on the surface, surface damage is inevitable and safety concerns can arise. In addition, these methods focus more on the analysis of inorganic pigments. Therefore, the use of a non-contact method capable of analyzing organic pigments is desirable to overcome these limitations.
To this end, we proposed hyperspectral analysis as an alternative for the pigment identification of Dancheong, which focuses on the green colors present in Dancheong. The pigments were selected by considering their use in modern and contemporary Dancheong, and they were made into samples using various mixing ratios and recipes. Through hyperspectral analyses, four main features were derived that can distinguish the types of pigments used for the color mixture. Based on the analytical results, a flowchart was designed for the pigment identification of green Dancheong. The results were examined and modified by actual on-site applications. This study is the first attempt to propose the application of hyperspectral analysis to modern and contemporary Dancheong. Further investigation of the proposed methods can provide a foundation for a faster and safer analysis environment for Dancheong sites.
2. EXPERIMENTAL METHODS
2.1. Materials
In this study, several pigments were selected considering their practical usage in modern and contemporary Dancheong (Bureau of Cultural Property, 1972;Jang and Han 1993; Cultural Heritage Administration, 1994; 2005; 2013; 2014; Kim et al., 1999). They were made into samples using acrylic emulsion adhesive(Polysol 506) as a binder and painted on a pinewood panel. The selected pigments and their historical usage in Dancheong are described as follows(Table 1).

List of pigments used in experiment and their historical usage in Dancheong
2.2. Samples
Three types of samples were made in order to investigate the material characteristics of each pigment and their changes along with mixing conditions. First, single-pigment samples were made to determine specific characteristics of each pigment. Second, pigments mixing samples(Table 2) were made to observe the changes caused by varying the ratios of two pigments. In this experiment, different pigments, namely TW, OW, PW, IY, and UB were added in different proportions based on the amount of PG. Lastly, Dancheong color samples (Table 3) were made based on the practical recipe in the field and a proposed recipe from 「Standard specifications for repair of cultural properties」(Cultural Heritage administration, 1994; 2005; 2014). Dancheong color samples were classified into three groups, Considering the general color classification of green in Dancheong, Noirok(grayish green, middle tone), Yangrok(bluish green, brightest tone) and Hayeop (deep green, darkest tone). The recipes and chromaticity of these samples are described as follows(Tables 2 and 3).
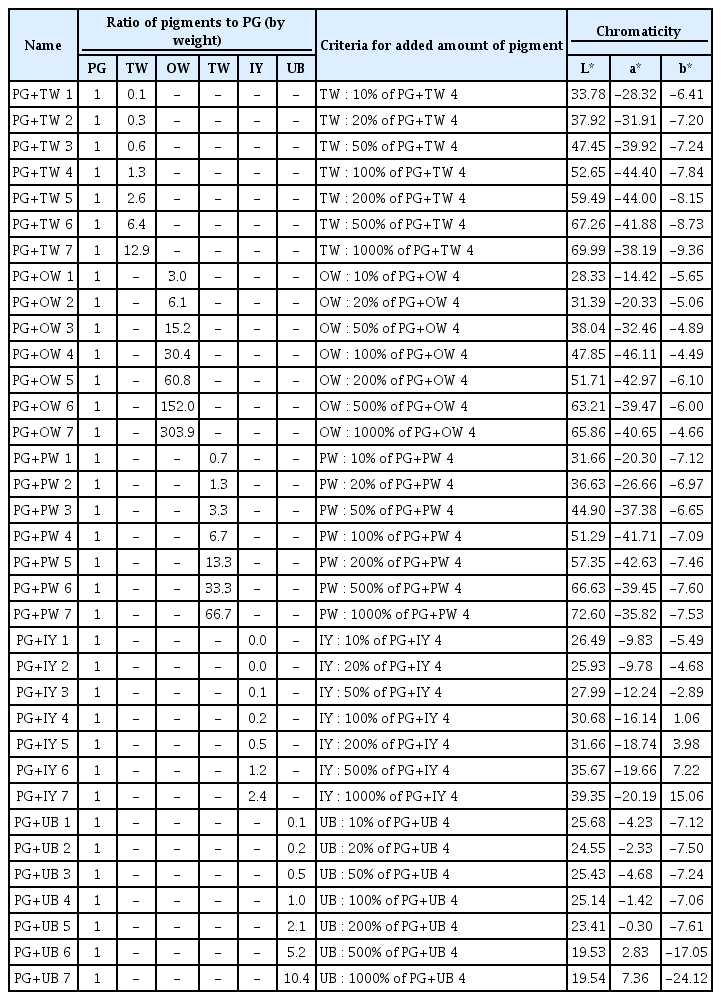
List of pigment-mixing samples and their chromaticity

List of Dancheong color samples and their chromaticity
2.3. Analysis
2.3.1. Surface-contact analysis
For cross-validation with hyperspectral analyses, conventional analytical methods used in the field of Dancheong analysis were carried out. Element analysis, surface observation, and chromaticity measurements are conventionally used, and because most of them require direct contact on the surface, they are grouped as “surface-contact analysis” in this study. Element analysis was done using a portable X-ray fluorescence spectrometer(Vanta C series, Olympus, USA), in Geochem mode, 30 s each for an acceleration voltage of 15 keV and 40 keV. Surface observations were done using a portable digital microscope(DG-3, Scalar, JPN), with a magnification of 200. The chromaticity was measured using a chromometer (CR-400, Konica Minolta, JPN) with D65 illumination in a 2° field of view. The measured value was presented as the value L*a*b* in the CIELAB color space. However, the data for Jungakdan was quoted from advanced research(Song, 2018).
2.3.2. Hyperspectral analysis
Hyperspectral analyses were carried out to acquire the reflectance spectra of objects. The device used for the samples and Jowoljeong was a hyperspectral camera PS-V10E(Specim, FIN), which covers the wavelength range from visible light to near infrared(400–1000 nm) using a prism-grating-prism (PGP) spectrograph and interline charge-coupled device (CCD) sensor. For Jungakdan, another hyperspectral camera FX10e (Specim, FIN) was used, which is also capable of spanning a wavelength of 400–1000 nm using a PGP spectrograph and a complementary metal-oxide semiconductor (CMOS) sensor. Specifications of both devices are described in Table 4. Basically, in the default setup, PS-V10E has a larger number of pixels and bands compared to FX10e, and it also has a higher spectral resolution. However, this could be adjusted by manipulating settings such as binning(Table 4). Both devices are operated with a rotary scanner(Figure 1). Specific measurement conditions are described as follows(Table 5). A calibration card (100%, 18%, Lastolite, GBR) was implanted beside the object to ensure exposure under the same illumination conditions, and the results were obtained within the same frame of the image(Figure 1). After the measurement, the reflectance spectra were extracted using the ENVI Classic program. Normalization was carried out by using a white reference in each image and removing dark current. The reflectance spectra were extracted from the region of interest (ROI) in the acquired image by averaging the values of selected pixels. ROIs were selected in an unshaded area from the image. In the case of the site image, several points were selected in narrow pixels, avoiding borderlines where pixel segmentation could be difficult, because borderlines could be blurred depend on focusing. The final data were smoothened in order to reduce the signal-to-noise-ratio (SNR).
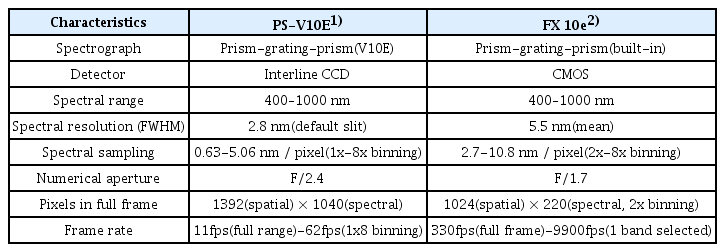
Specifications of hyperspectral cameras
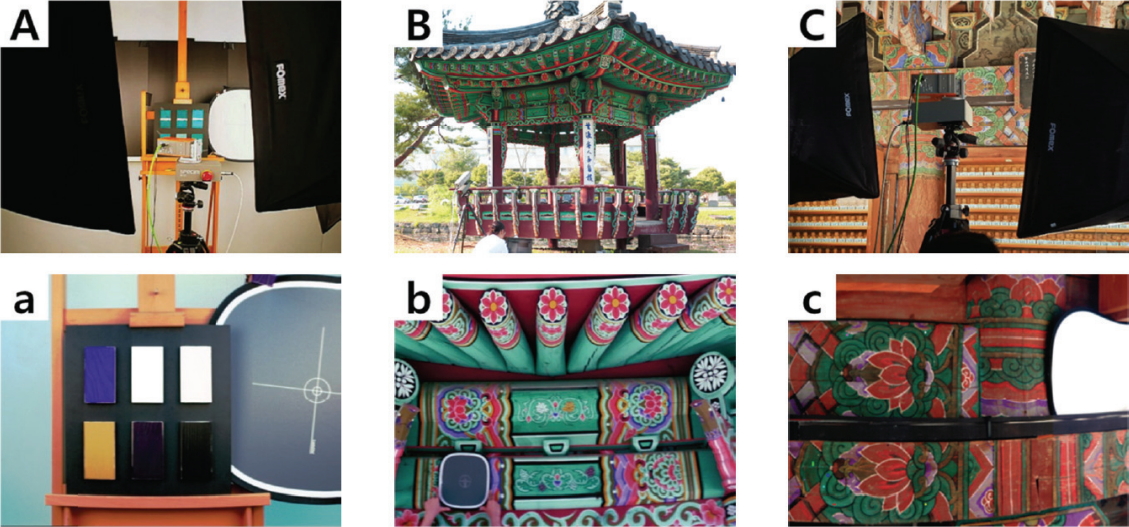
Hyperspectral analysis application on samples and sites. Measuring environment of samples(A), Jowoljeong(B) and Jungakdan(C), and acquired images of samples(a), Jowoljeong(b) and Jungakdan(c) by hyperspectral camera.

Environmental conditions and instrument setup for hyperspectral data acquisition
2.4. Site application
Hyperspectral analyses and conventional methods were applied on two different site objects. The first one, which represents modern Dancheong in the late 19th century, is the Jungakdan shrine in Gyeryongsan mountain, Gongju, which is Treasure No. 1293 in Korea. It is indicated below as “Jungakdan.” The other one, which represents contemporary Dancheong, is the Jowoljeong pavilion at the Kore National University of Cultural Heritage, and contemporary Dancheong was applied on it in 2003. It is indicated as “Jowoljeong” below. In Jungakdan, the Yangrok and Hayeop colors were investigated, while the Noirok, Yangrok, and Hayeop colors were examined in Jowoljeong.
3. RESULTS AND DISCUSSION
3.1. Surface-contact analysis result for single pigments
The basic material characteristics of each pigment were studied using surface-contact analysis by measuring singlepigment samples. Their results are described in Table 6 and Figure 2. In the case of EG, it showed bright green colored particles that are homogeneously round shaped. Moreover, As and Cu were detected as their principal component. PG appeared in the form of a deep bluish-green dyeing pigment without any particles permeating the wooden surface. Although Cl, Cu, and other elements were detected, it is difficult to consider them as principal elements owing to their low intensity. CG appeared to consist of homogeneous dark yellowish-green particles, and Cr was detected as its principal element. In the case of ClG, large green particles with dull edges were observed, and Fe and K were mainly detected. IY showed yellow particles having various sizes and with Fe as its principal component. UB was observed with relatively homogenous blue particles, and S, Si, Fe, and Al were detected at low intensities. In the case of TW, extremely fine white particles were present in the paint film, and only Ti was detected. OW comprised relatively large and nonuniform white particles, having some undispersed lumps. Ca was detected as its principal component. PW appeared as a white coating in which fine white particles were evenly dispersed in the binder. Ti and Ca were mainly detected, but Si and Al were also detected simultaneously. In the case of PBk, the particle size was so fine that it appeared in the form of a black dye permeating the wooden surface. Although some light elements such as S or Ca were detected at low intensities, they are not considered as the principal elements.
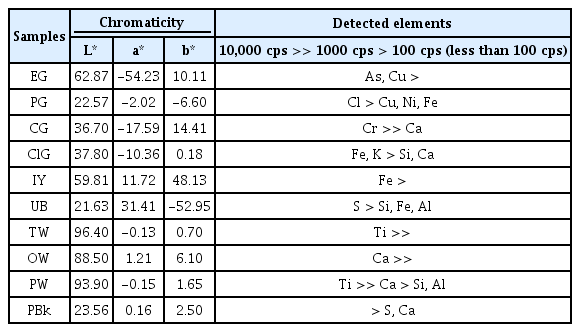
Chromaticity and element analysis results of single-pigment samples
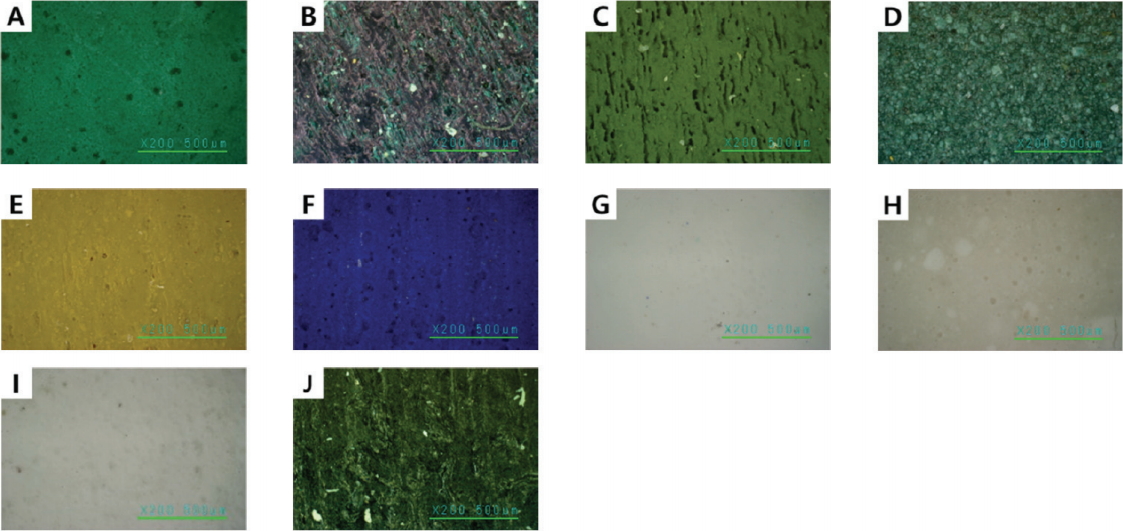
Microscopic images (×200) of single-pigment samples[EG(A), PG(B), CG(C), ClG(D), IY(E), UB(F), TW(G), OW(H), PW(I), PBk(J)].
3.2. Spectral characteristics of single pigments
Each pigment shows distinguishable spectral features. In the green pigment group, EG, PG, CG, and ClG show major peaks near 520 nm, 500 nm, 540 nm, and 530 nm, respectively, and there are differences in their shape and intensity. Minor peaks appeared only in PG and CG. PG has two minor peaks at 673 nm and 752 nm, while CG shows it near 410 nm. In the infrared range above 700 nm, while EG and ClG have low reflectivity without overall fluctuations, PG shows a gradual increase in the reflectance after 800 nm. At the same time, CG shows a continuous increase from 720 nm, then maintained a high reflectivity at a constant level after 800 nm. The other color pigments also exhibited individual characteristics, and they are also illustrated in Figure 3.
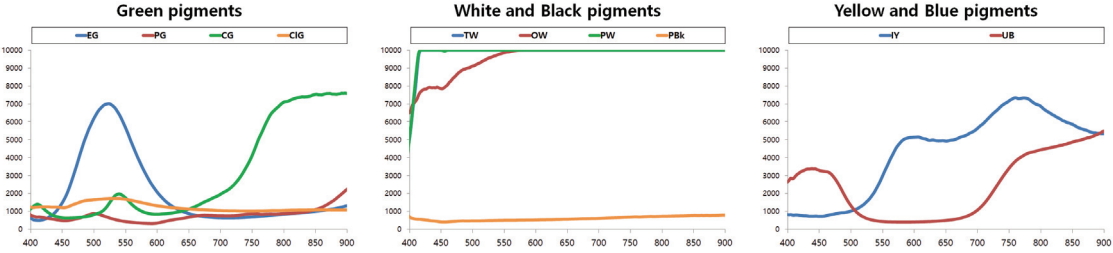
Reflectance spectra of selected green pigments(EG, PG, CG, ClG) and other pigments that were added for green colors(IY, UB, TW, OW, PW, PBk) of modern and contemporary Dancheong.
3.3. Variation of spectral characteristics with pigment mixing ratio
When white pigments were added to the same amount of PG, TW and PW exhibited a similar profile change(Figure 4). As the amount of TW and PW increases, the reflectivity over the entire region increased. The major peaks maintained high and narrow shapes. The characteristic minor peaks of PG also exhibited an increased reflectivity, but their locations were shifted from 673 and 752 nm to 710 and 770 nm, respectively. In the infrared region, the reflectivity increased rapidly after 800 nm. However, OW-mixed samples present slightly different features as greater amounts of OW were added. The approximate locations of the major peak and minor peaks, as well as the reflectance pattern in the infrared region remained approximately constant. However, the major peaks tended to be redshifted, and reached 510 nm when the largest amount of OW was added, exhibiting a lower and broader shape in comparison(Figure 4).
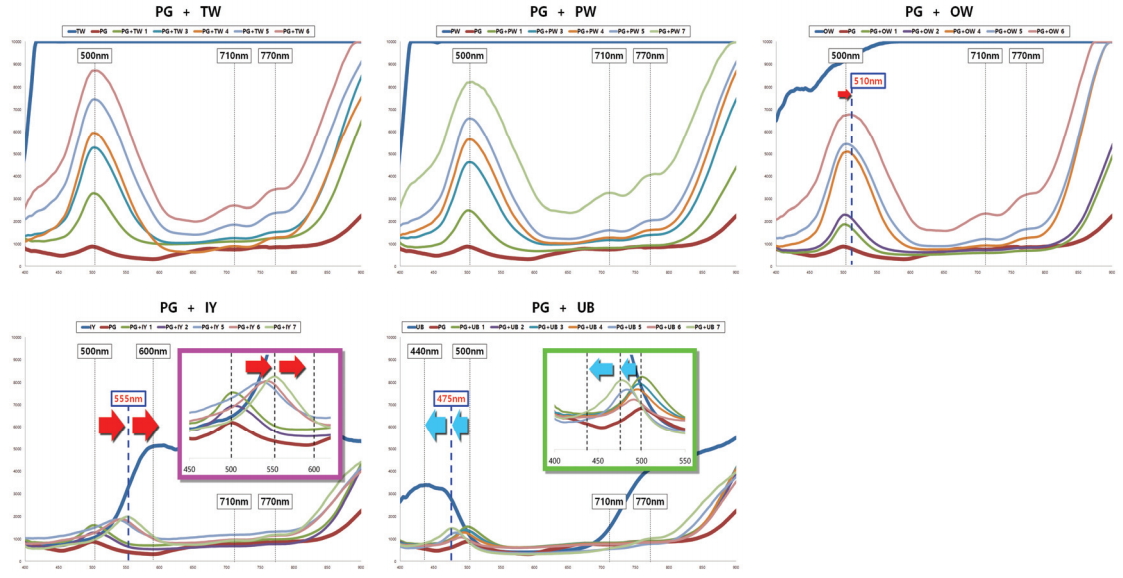
Changes in PG reflectance spectra according to the ratio of white(TW, PW, OW), yellow(IY), or blue(UB) pigments.
In the case where IY or UB was added to the PG samples, although they maintain the basic profile of PG, gradual changes were observed, especially in their major peak. The inflection point of major peaks tended to be redshifted or blueshifted, respectively, from the point at which a certain ratio of IY or UB was added(Figure 4). In the case of the PG+IY 7 sample, the major peak appeared near 555 nm; however, PG+UB 7 showed its major peak at 475 nm. Otherwise, the basic profiles remained constant. Minor peaks were appeared constant at 710 and 770 nm, and in the infrared range, the reflectance started to increase gradually after 800 nm.
3.4. Variation of spectral characteristics with green Dancheong color samples
Dancheong color samples were divided into three groups, namely Noirok samples, Yangrok samples, and Hayeop samples. Their spectral characteristics are described and illustrated as follows(Table 7, Figure 5).
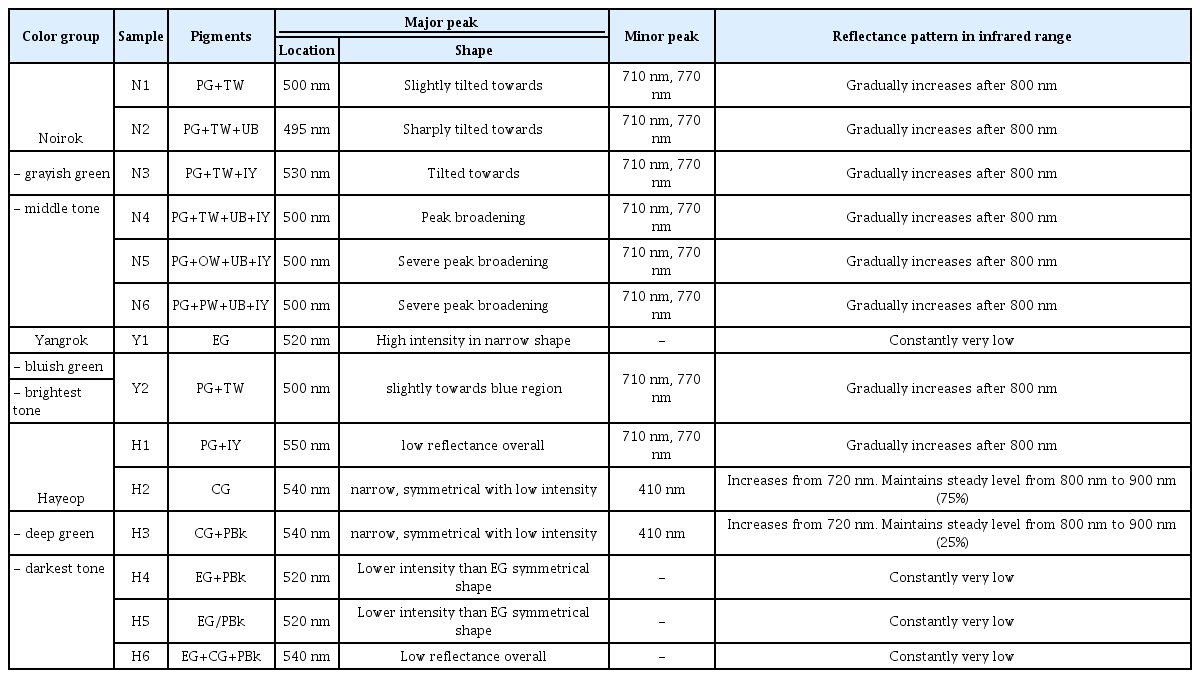
Spectral characteristics of Dancheong color samples
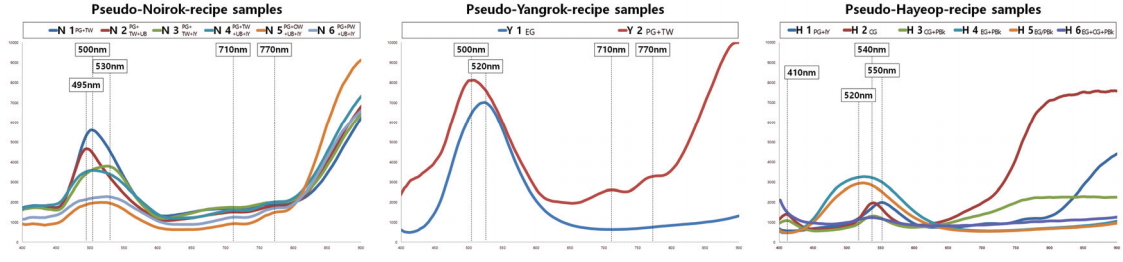
Reflectance spectra of Dancheong color samples.
These results indicate that when PG is the main pigment, its major peak can move freely with the addition rate of yellow or blue pigments, while white pigments do not have a significant effect on its shifting. Nonetheless, the existence of PG can easily be distinguished by its characteristic minor peaks at 710 and 770 nm, and the reflectance increases after 800 nm. In the case where CG is used as the main pigment, it can be clearly identified with its major peak at 540 nm and reflectance pattern above 720 nm. The existence of PBk can be verified by comparing the ratio between the intensity of the major peaks at 540 nm and that of 800 nm.
EG and their mixtures generally exhibit a major peak near 520 nm without any minor peak or increase of reflectance in other ranges.
3.5. Flowchart design for identification of green pigments of modern and contemporary Dancheong using hyperspectral analysis
By comparing data obtained from different samples, it was possible to determine four main factors that can differentiate between the green pigments that were mainly used for green colors of modern and contemporary Dancheong as follows.
1) Appearance of the major peak in the green wavelength range(495-500 nm)
2) Shape and intensity of the major peak
3) Existence of minor peaks
4) Reflectance pattern in the infrared region(above 700 nm)
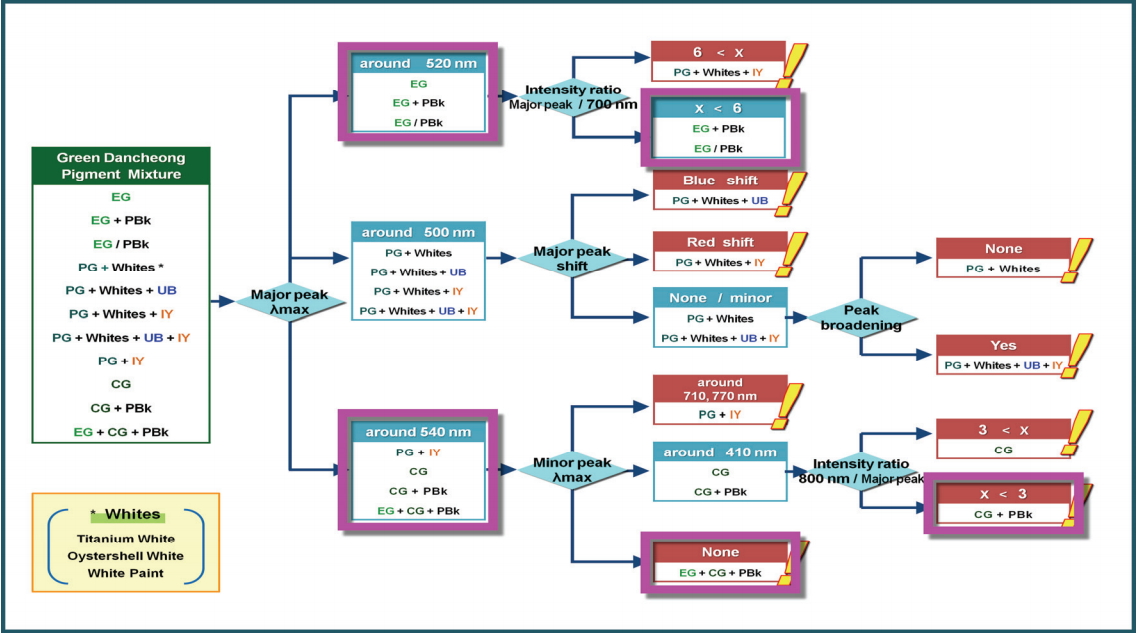
Based on this, a pigment-identification system could be designed in a flowchart format(Figure 6).
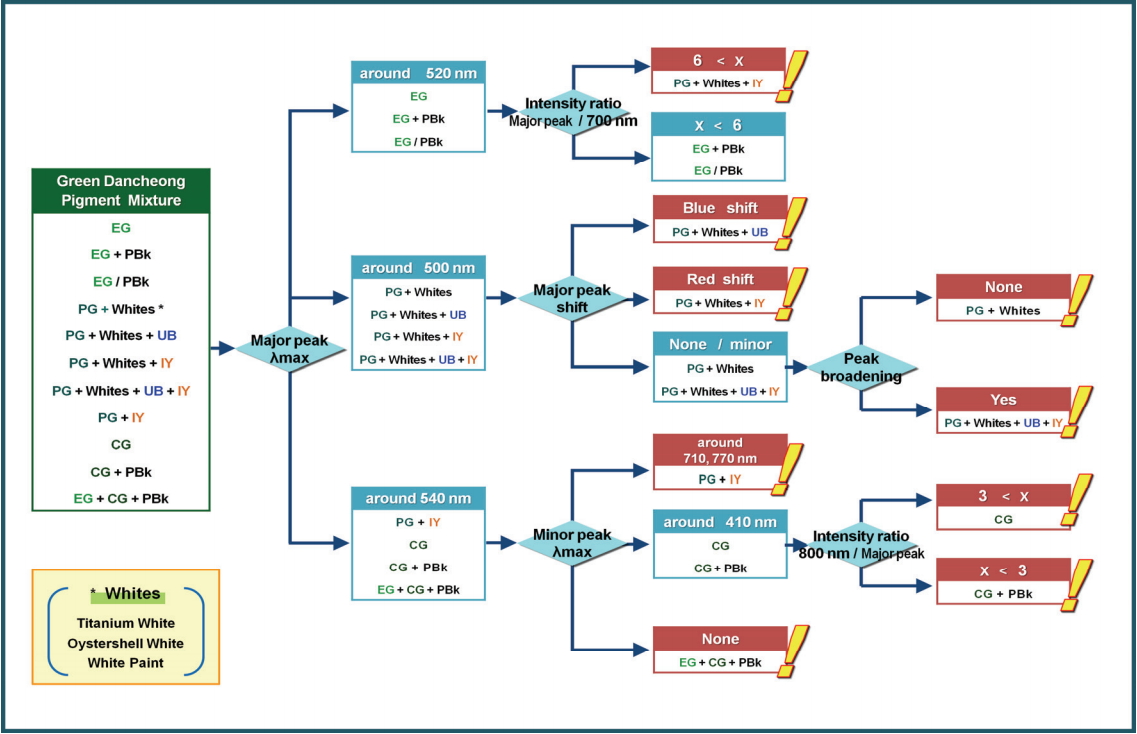
Flowchart for identification of green pigments of modern and contemporary Dancheong using hyperspectral analysis.
The pigment combination that can be interpreted with their reflectance spectra can be distinguished into three groups, namely, PG and their mixture, CG and their mixture, and EG and their mixtures. Because it has been proven that for white pigments TW, OW, and PW, there is little difference in terms of their reflectance, they were grouped together as “Whites.”
The location of the major peaks is the first condition. They can approximately be classified into three groups near 500 nm, 520 nm, and 540 nm.
In the case of 520 nm, the sample with EG and their mixture falls within this category. PBk does not affect the location of their major peak, whether it is mixed or overlaid. However, their intensity in the major peak significantly decreased, whereas there were few changes in the infrared region. Thus, it is possible to differentiate them from solid EG by comparing the intensity ratio between the major peak and at 700 nm. In the case of EG, the ratio exceeds 10, while it was less in the others. However, using only the reflectance features, it is difficult to ascertain whether PBk was mixed or overlaid.
Secondly, when the major peak appears near 500 nm, it could be classified as PG+Whites samples or IY or UB added samples on them. They can again be classified based on the shifting direction of the major peak, which shifted towards the red range when only IY was added to PG+Whites, and which blueshifted when only UB was added to PG+Whites. However, when there are no shifts, whether major or minor, it is difficult to determine instantly whether they are only PG+Whites or PG+Whites+IY+UB. In this case, they can be differentiated based on the widths of the peaks.
Finally, when the major peak is located near 540 nm, PG+IY, CG, CG+PBk, and EG+CG+PBk are in agreement. The next step that is employed to classify them involves their minor peaks when they appear at 710 and 770 nm, and it can be identified as PG+IY. However, the minor peak near 410 nm is a characteristic feature of CG and a CG-based mixture. CG and CG+PBk can be distinguished based on the ratio between the intensities of the major peak(540 nm), and thereof 800 nm, where the reflectance in the infrared region becomes constant at a certain level. When only CG was used, the ratio becomes more than three times, while it is less than that when PBk was mixed. In the case of EG+CG+PBk however, any minor peak is not observed.
3.6. Site application
3.6.1. Jungakdan, Gyeryongsan
1) Surface-contact analysis
In an advanced study, the Yangrok color in Jungakdan was measured as L* 46.5(±5.3), a* -1.1(±4.0), b* 12.1(±3.6). Further, it was observed that it consisted mainly of green particles and a few colorless transparent crystals. Cu and As were detected, and their ratio of Kα was nearly 1:1.7 by counts per second. In addition, a small amount of Ba was detected, indicating that the transparent crystals could be Barium sulfate(BaSO4). Therefore, the pigment used in Yangrok in Jungakdan could be presumed to be Emerald green or another Cu-As pigment mixed with a small amount of Barium sulfate.
On the other hand, the Hayeop color was measured as approximately L* 35.7(±5.7), a* -3.2(±5.4), b* 10.2(±2.1). Further, it was observed that it consisted mainly of green particles and few colorless transparent crystals. Cu and Cl were detected as the principal components, with small amounts of Ca, Fe, Zn, As, Ba, and Sr. In addition, the intensity of Cu was higher than that of As. Therefore, Hayeop in Jungakdan could be assumed to be a mixture of copper corrosion(patina) based greens and Emerald green, which were used in the Yangrok color.
2) Hyperspectral analysis
The spectra were extracted from five different points by selecting a narrow space for pixels in well-preserved paint layers. Overall, both Yanrok and Hayeop exhibit very low reflectance levels.
In the case of Yangrok, the major peaks generally appeared near 550 nm; however, at some points, they were located near 530 nm, and no minor peaks were observed at any point(Figure 7). The designed pigment-identification flowchart presented above was applied on the Yangrok colors in Jungakdan.
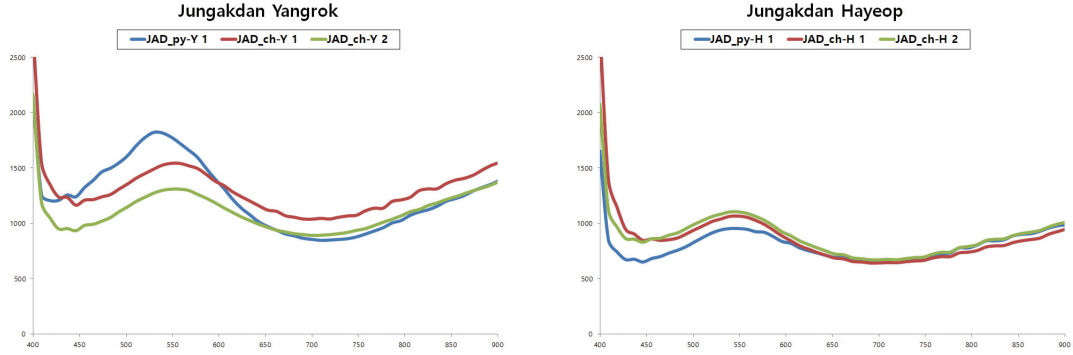
Reflectance spectra of Yangrok and Hayeop colors in Jungakdan.
The main pigment could be classified as being Emerald green based. However, it was difficult to determine which other pigments were added because their redshifted major peaks are unfixed along the measuring points, as well as because of their low reflectivity values. In the surface-contact analysis, Yangrok was identified as a mixture of Emerald green and colorless transparent Barite(BaSO4). This does not correspond to the preliminary experiment result in which the major peak shift occurs only when pigments having different colors are mixed. Therefore, it can be presumed that there may be other sources of interference other than the simple combination of pigments.
Likewise, in the case of Hayeop, the major peaks generally appeared near 545 nm. However, they tended to be unfixed along with the locations. No minor peaks were observed at any point, and they generally have very low and not fluctuate reflectivity values(Figure 7).
With respect to the application of the pigment-identification flowchart for Hayeop, it appeared to be similar to EG-mixed samples based on their reflectance features. However, it was difficult to identify them accurately because their major peaks are located in the longer wavelength range and are broader. In surface-contact analysis, Hayeop was identified as a copper corrosion(patina)-based pigment. Unfortunately, it is difficult to define the exact type. Furthermore, it could not be considered in this experiment because this type of copper corrosion-based pigment was unavailable. In summary, Hayeop color in Jungakdan does not appear to correspond to the current pigment-identification flowchart(Figures 8 and 9).
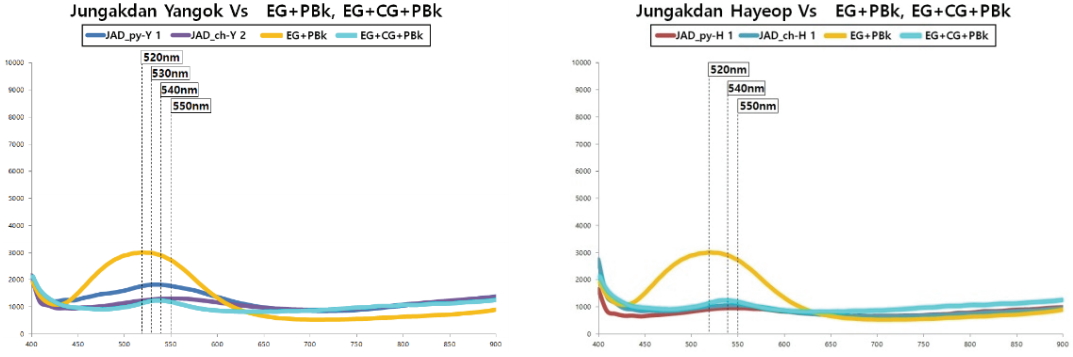
Comparison between Jungakdan Yangrok and Hayeop to Dancheong color samples.
Application results of Jungakdan Yangrok and Hayeop on flowchart for identification of green pigments of modern and contemporary Dancheong using hyperspectral.
3.6.2. Jowoljeong, Korea National University of Cultural Heritage
1) Surface-contact analysis
In the case of Noirok and Yangrok color in Jowoljeong, their chromaticity values were measured as L* 59.4(±0.6), a* -41.0(±1.1), b* -4.7(±0.2), and as L* 67.7(±3.9), a* -29.2(±2.8), b* -3.8(±0.6), respectively. No particulate pigments were observed other than white particles on the surface. Instead, for both of them, a non-particulate deep, vivid bluish-green color appeared between the white particles like dyes. Ca was identified as a principal element, while Ti and S both exhibited low intensities; however, Yangrok had a higher intensity of Ca. Nonetheless, no elements that indicate green colors were detected in either of the two colors. Thus, it is difficult to accurately identify the pigment responsible for their green hue. Generally, both Noirok and Yangrok were identified as a liquid or non-particulate pigment were mainly used, and white pigment was also mixed as an extender. In particular, Yangrok appears to contain a greater amount of white pigment.
However, the chromaticity of Hayeop color was measured as L* 37.7(±0.5), a* -16.9(±0.1), b* 14.4(±0.2), and it had a dark yellowish-green color. The surface comprised homogeneous deep green particles without any other colors, but a light-green colored pigment layer was observed beneath and between cracks. Significant amounts of Cr and Ca were detected, while Ti was detected at a lower intensity. Based on this, the surface pigment of Hayeop was assumed to be Cr-based chrome oxide green, and the lower layer as being Ca and Ti-based.
2) Hyperspectral analysis
In the hyperspectral analysis, Noirok and Yangrok in Jowoljeong exhibit their major peaks near 500 nm and 510 nm, respectively, and Yangrok has a higher reflectance overall. However, they have minor peaks at 710 and 770 nm, and there is a gradual increase in the reflectance after 800 nm. Those spectral factors correspond to the characteristics of PG. Upon a comparison of PG+Whites samples from this study, they appeared to exhibit more broadening in the major peak, especially Yangrok, yet they were not shifted or severely biased as was the case of those of PG+Whites+IY or PG+Whites+UB samples. Compared with PG+Whites+UB+IY samples, the top of the major peak in Noirok and Yangrok was generally not extensively broadened, then only broadened at both ends. Hayeop presents characteristic spectral features of CG, including a major peak at 540 nm, a minor peak at 410 nm, and reflectance patterns in the infrared region(Figure 10).
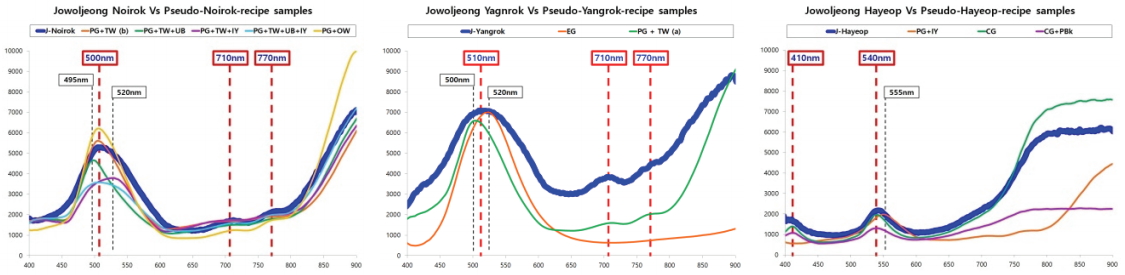
Comparison of Jowoljeong green colors with Dancheong color samples.
For Noirok color in Jowoljeong, it could be easily determined that PG was used as the main pigment for green color. It was also classified as PG+Whites+UB+IY using the major peak location and peak-broadening steps in the pigment-identification flowchart.
For Yangrok, it could also be easily determined that PG was used as the main pigment for green color. It was also classified as PG+Whites+UB+IY using the major peak location, minor shift in the major peak, and peak-broadening steps in the pigment-identification flowchart. However, these results are incompatible with the result obtained from the surface-contact analysis, which indicated that no other colored pigment was used, other than Ca, Ti-based white pigment, and green dyeable pigments.
On the other hand, Hayeop was classified as solid CG in the pigment-identification flowchart based on its spectral features. This corresponds to the results obtained from the surface-contact analysis(Figure 11).
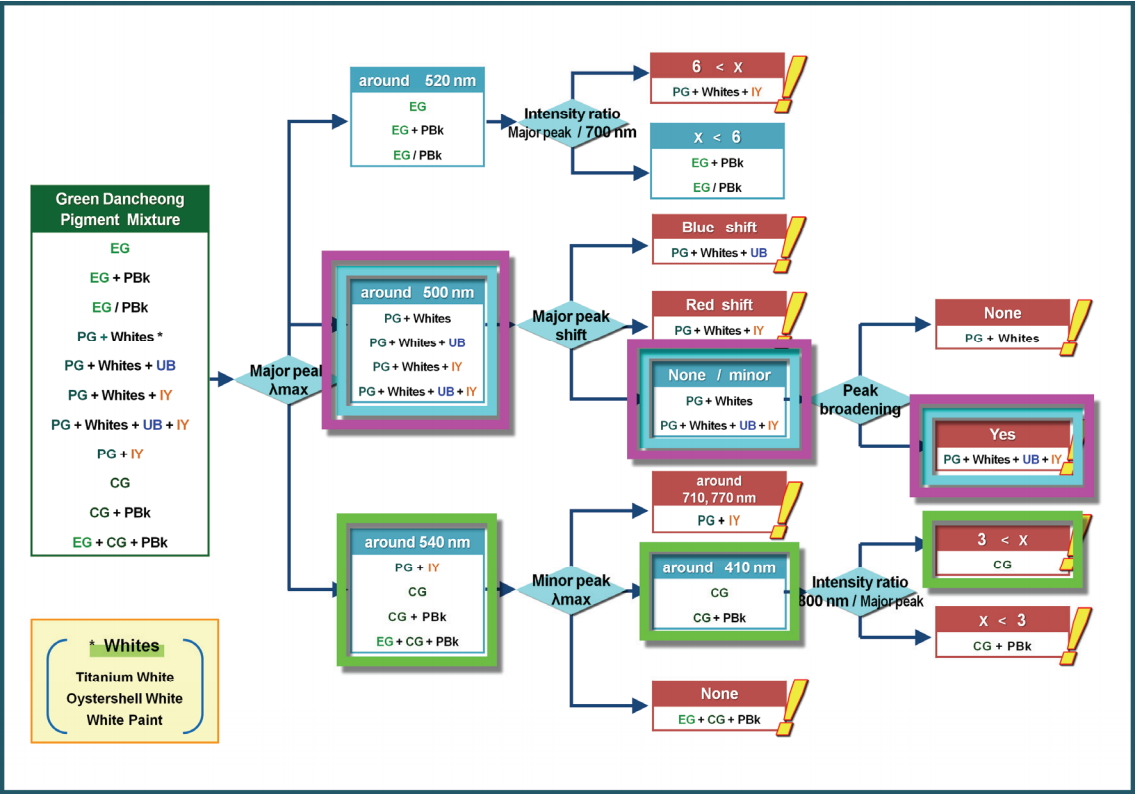
Result of application of Jowoljeong green colors on flowchart for identification of green pigments of modern and contemporary Dancheong using hyperspectral analysis(Magenta: Noirok, Cyan: Yangrok, Green: Hayeop).
3.7. Complementation of Flowchart
In this study, a pigment-identification flowchart was designed for the green colors of modern and contemporary Dancheong based on their spectral features. As a result, this flowchart could identify the main green pigments. Furthermore, it also helped to determine which other pigments were mixed in the colors.
However, some limitations were encountered during the site application because there are various factors that can affect data interpretation. Those interference factors and their complementary measures are as follows.
<Internal and external factors that cause errors in pigment-identification flowchart>
① Impurities present in used pigments
② Contaminants on the surface of the paint layer
③ Interference from underneath layers owing to low hiding power of surface-paint layer
④ Physical or chemical changes to pigments after coloring
⑤ Physical and chemical differences between experimental pigments and the original ones used
The presence of impurities and surface contaminants interrupt the acquisition of the pure spectra of the material by scattering or observing the incident light.
In the case of assumption ①, this corresponds to the case of Jowoljeong Yangrok and Noirok.
The broadening and minor shift in the main peak were assumed to result from the white or extender pigment. More specifically, based on advanced research on the material supply situation on manufacturing sites at that time(Lee et al., 2008), it is assumed that less refined and defected Oystershell white(UW; Unrefined Oystershell white containing a greater amount of impurities) was used in the Yangrok and Noirok colors in Jowoljeong. The spectral influence of UW on PG was examined in this study by adding the same constant ratio of OW and UW to the same amount of PG. The greater the amount of UW that was added, the major peak became broader and lower, unlike the case with refined OW. The minor redshift in the major peak of Jowoljeong Yangrok can be explained by the phenomenon that happens when a large amount of OW is added to PG. Therefore, in such a case, it could be understood to some extent by investigating the impurity content in the pigment used in the field, and by studying the effect on them. However, it would be timeconsuming and tedious to consider all of the possibilities. Therefore, another faster site-analysis method is proposed as an alternative approach, i.e., the use of microscopy should be considered to supplement the flowchart. Although it may nullify one advantage of hyperspectral analysis as a longdistance measurement tool, this would be completed by the continuous accumulation of data. In the case of assumption ②, owing to their distinctive locations, Dancheong is likely to be affected by dirt, soil, and other biological contaminants. Furthermore, some exudate from wooden support could cause stains or contaminants on the surface. To prevent errors that are related to these problems, consideration should be given to cleaning the surface in advance of the measurement, or to select areas that are less affected by those factors. In the case of assumption ③, the underneath-layer interference occurs mainly because of the low hiding power of the surface pigment, low thickness, or low particle density of the surface layer. These interrupt the acquisition of the pure reflectance spectra of the surface pigment. In particular, when the underneath wooden support affects, the major peak of the reflectance spectrum tends to be redshifted. The case of Jungakdan, Yangrok, and Hayeop appears to be relevant for this assumption. Therefore, to minimize the influence, it is recommended that the selected areas are where the surface pigment is thick and well preserved. The former three assumptions are affected by external causes rather than the pigments themselves, and yet these interference factors determine the linear and non-linear spectral mixing of the pure reflectance of surface pigments. In the case of linear mixing, it can be excluded through spectral unmixing. Spectral unmixing is the process involving the extraction of the endmember, which means the pure spectral data of material, and their abundance, namely the level of contribution.. On the other hand, in the case of non-linear mixing, it is required to undergo a much more complex procedure(Bioucas-Dias et al., 2012,Kim, 2003). In this case, to guarantee accuracy in the pigment identification, it is necessary to continuously accumulate data that reflect these external factors, while the application of a statistical technique should also be considered.
Assumption ④ refers to the physicochemical changes of pigments themselves, which are derived from various interactions with external factors such as exudate from wood, microorganisms living in wood, and other environmental factors(Shin and Ahn, 1996). For example, Cu-As-based pigments, including Emerald green and Scheele’s green, are easily darkened as they react to sulfur or sulfide from atmospheric pollutants. Therefore, it is necessary to simultaneously carry out contact-nondestructive analysis such as XRF microscopy to complement hyperspectral analysis until sufficient data are achieved. Finally, assumption ⑤ is the case where the names of the pigments are the same, and the materials are similar, but details regarding the physical and chemical properties of the pigment differ owing to their manufacturing technique employed. As an example, for Yangrok, both Scheele’s green and Emerald green were grouped under the same color or commercial name of “Yangrok”, in spite of their chemical and crystallographic differences. Furthermore, some advanced studies have proven that even Emerald green possesses several types of crystalline structures arising from different manufacturing processes. The particle size and structural characteristics affect the refractive index, which determines the hiding power and hue of the pigment, and it consequently results in spectral differences. In this study, the cases of Jungakdan, Yangrok, and Hayeop are relevant to this assumption. The Emerald green used in the experiment sample was different from that of the Jungakdan site, which already cannot be sourced. Consequently, they could not be applied correctly to the flowchart. In the cases of assumption ④ and ⑤, precise pigment identification would be limited when only hyperspectral analysis is used because the problem is derived from the components and material properties of the pigments themselves. Thus, the use of existing analytical techniques should be considered to complement it.
However, once clear criteria and its variable data are determined by studying the physicochemical changes of pigments and site samples, the hyperspectral technique can be used as a pigment-identification method.
4. CONCLUSION
In this study, hyperspectral analysis was applied to the pigment identification of green colors in modern and contemporary Dancheong. Based on their reflectance spectra, it is possible to derive four main features that can be used to distinguish which types of pigments were used in the color mixture. These four main features are the location of the major peak in the green wavelength range(495–550 nm), the intensity and shape of the major peak, the existence and location of minor peaks, and the reflectance pattern in the infrared range. Based on this, a flowchart was designed for the pigment identification of modern and contemporary Dancheong. The flowchart was also verified and supplemented by its application on a site and reflected the characteristics of materials used in the practical site. With this approach, it was proven that hyperspectral analysis can counter limitations of existing analytical methods that are mainly suitable for inorganic pigments, or which have accessibility issues when applied in the field. These features can be advantages for modern and contemporary Dancheong because they were in high use in organic pigments or mixed pigments.
Meanwhile, five factors that can limit the accuracy of hyperspectral data were determined based on the site application. These five factors are ① The presence of impurities in used pigments, ② Contamination of the surface of the paint layer, ③ Interference from the underneath layers owing to the low hiding power of the surface paint layer, ④ Physical or chemical changes to the pigments after coloring, and ⑤ Physical and chemical differences between experimental pigments and those used in the original objects. To reduce their effect on the analysis, several solutions can be proposed. In site application, it is important to select a proper analysis point at which there are fewer interference factors. For the data accumulation, it is necessary to consider not only the construction of samples that reflect the variables but to also acquire as much as possible data from the original field objects. At the same time, other complementary analysis methods should be employed until sufficient criteria are satisfied.
In conclusion, this study confirmed the potential of the hyperspectral technique as a pigment identification method for modern and contemporary Dancheong. The development of a database that reflects various materials, mixing ratios, painting techniques, and other external interference factors is expected to provide a foundation for faster and safer analysis environments at the Dancheong site.
Acknowledgements
This work was carried out as a part of the <Development of diagnostic and analytical techniques for preservation, certification, and identification of modern paintings> project, which was led by the Korea Creative Content Agency, CON-TECH, University Enterprise, Korea National University of Cultural Heritage.