


1. INTRODUCTION
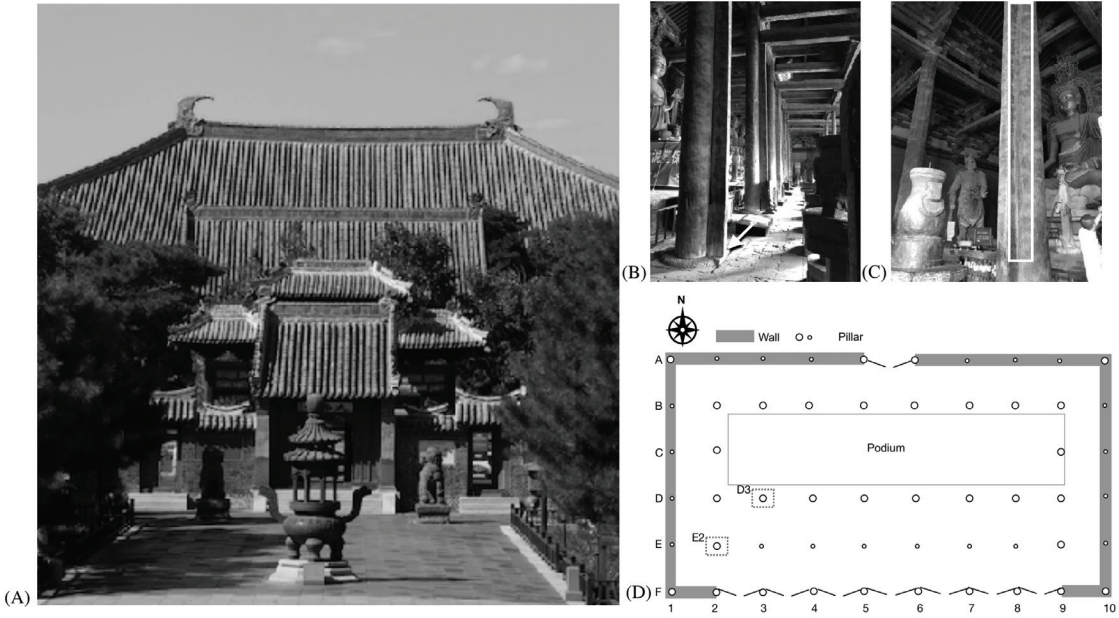
The Main Hall of the Fengguo monastery in Yixian county, Liaoning province, China, was built in the ninth year of the Kaitai period of the Liao dynasty(A.D. 1020). As the best preserved and largest wooden Buddhist structure in the typical Liao dynasty style in China, it was declared as a state priority protected site in 1961. In 2013, it was submitted to the Tentative List of World Heritage Sites, nominated as “Wooden Structures of Liao Dynasty—Wooden Pagoda of Yingxian County, Main Hall of Fengguo Monastery of Yixian County.” As shown in Figure 1, the 56 wooden pillars of the Main Hall are set on a carved limestone foundation, with surrounding brick floor(Centre for Preservation of Cultural Relics in Liaoning and Cultural Relics Preservation Institute in Yixian, 2011). The pillars are labeled as rows A–F and columns 1–10, as shown in Figure 1D.
Two significant types of degradation have occurred on the timber frames of the Main Hall-and these are cause for concern, in terms of the long-term preservation of the monastery.
Whitening of the wooden pillar bottoms can be seen where they contact the stone base. In addition, a type of surface damage—seen mostly on the D pillar row(D2–D9)—can be seen at higher points, mostly higher than one m above-ground. Each pillar consists of a main circular form, with a smaller, square section in front(Figure 2B). The surface damage is located at the gap between the circular and square pillar elements and consists of a lighter brown coloration, accompanied with loose surface wood tissue.
In this study, we examined both degradation phenomena, with the objective of determining their chemical features.
2. MATERIALS AND METHODS
In order to quantify the extent of the whitening phenomenon in the wooden pillar bases, its vertical extent was measured by tape measure in each pillar, except for those embedded in walls. Overall, 26 pillars in rows B–E, and columns 2–9, were measured.
2.1. Sampling methods
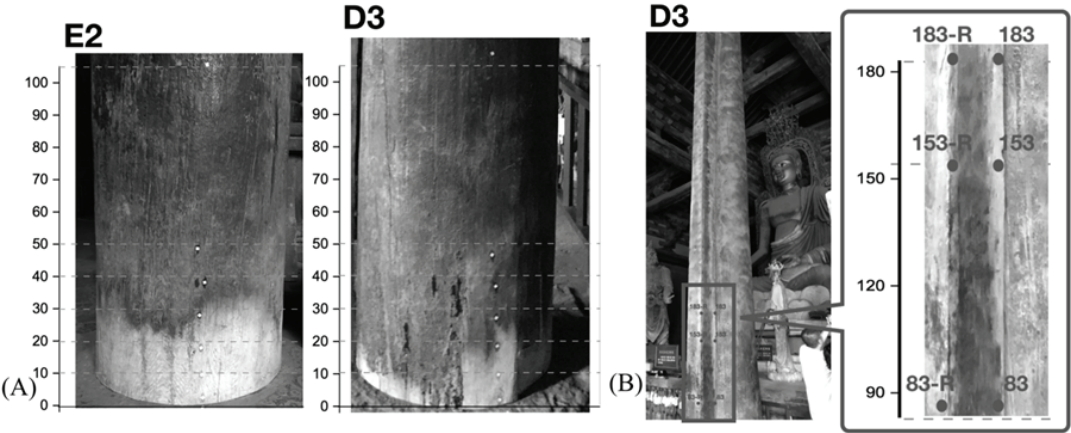
In this study, the whitening phenomenon areas in pillars E2 and D3, and the surface-damaged area of pillar D3 were selected as being representative subjects for sampling. The sampling method was to scrape ~10 mg of wood tissue gently from the pillar surfaces—from the sample location shown in Figure 2—using a double bladed razor. The samples were then ground into wood powder with a particle size of 177-250 μm, in an agate mortar.
In areas with the whitening phenomenon, six points were sampled, at 10 cm, vertical intervals over the initial 50 cm extending up from the stone base, with a point 105 cm above the stone base was used as a reference. For the surface-damaged areas, points near the gap between the circular and square pillars, and the corresponding reference points on the front of the square side, were sampled, at 83, 153, and 183 cm heights. The samples were labeled using pillar row IDs and sample heights–for example, for pillar D3, samples were named D3-0, D3-10, D3-20, and so on, for the whitening phenomenon samples. For the surface-damaged areas, sample locations followed a similar code, with the investigated point, D3-183, denoting the damaged area 183 cm from the base of pillar D, with its corresponding reference sample labelled D3-183-R.
2.2. Analysis methods
Additional substances, free ion content, chemical features of wood samples were determined using X-ray diffraction (XRD), ion chromatography(IC), and Fourier transform infrared attenuated total reflection(FTIR-ATR) analyses—and then an FTIR spectra comparison study was performed, using principal component analysis(PCA).
2.2.1. XRD analysis
XRD analyses were conducted, using a D8 ADVANCE/ TSM(D8 ADVANCE/TSM, Bruker, USA) under conditions of 1.542 nm CuK α radiation, at 40 mV/40 mA, over a 5–70°, two theta interval, at a scanning speed of 0.5 s/step(6000 steps in total). DIFFRACT. EVA(Version 3.2) software and the International Centre for Diffraction Data(ICDD) database were used to identify sample crystalline content. XRD spectra were normalized by setting the maximum and minimum to one and zero, respectively.
2.2.2. IC analysis
The mobile anion and cation contents in sample water extracts were qualified using IC analysis. Water extracts were prepared using ~5 mg ground wood powder immersed in 10 ml ultra-pure water(water to standard JIS A4) for 48 h, then filtered using a syringe filter(0.45 μm pore size, regenerated cellulose-membrane)(Minisart, Satorius, DEU). IC analysis was carried out using a Methrohm 883 Basic IC Plus(883 Basic IC plus, Methrohm, CHE). Anion analysis was conducted using a METROSEP A Supp 5 25/4.0(6.1006.530) column, 3.2 mM Na2CO3 and 1.0 mM NaHCO3 eluent solution, 0.700 ml/min flowrate, and 30 min running time-with peak areas then calculated using MagIC Net(version 3.1) software. The detected ions were quantified using the weight of the corresponding powder samples, and the ion contents were summarized as a weight percentage of the wood(Wt%: mg/mg).
2.2.3. FTIR-ATR analysis
FTIR-ATR analysis was performed on ~2 mg of sample powder, using an FTIR spectrometer equipped with an ATR unit(Spectrum One (B), PerkinElmer, USA), from 4000–400 cm-1, with a resolution of 4 cm-1, and an average of 64 scans, at room temperature and pressure. The spectra were first smoothed using block averaging(9 points), then baseline corrected and normalized using Spectrum v3.00 software (Spectrum v3.00, PerkinElmer, USA). Baseline correction was performed using the manual method, applying baseline through points at 1800, 1773, 1496, 834, and 400 cm-1, while normalization was performed with 1800 cm-1 set as zero, and the maximum set to one.
2.2.4. PCA
PCA is a multivariate statistical technique. It was used in this study to compare FTIR spectra and determine the degree of variance between the samples from different locations. The basic concept of PCA is to simplify data with multiple variables into a smaller number of uncorrelated variables, which still contain most of the information in the original data. PCA was performed with Origin Pro 2019 software, using a covariance matrix. The obtained principal component(PC) score was applied to identify variances between FTIR spectra. The obtained loadings for each PC were applied to present contributions from each FTIR spectra wavenumber to the individual PC variances.
3. RESULTS AND DISCUSSION
3.1. Whitening phenomenon areas
3.1.1. XRD and IC analysis
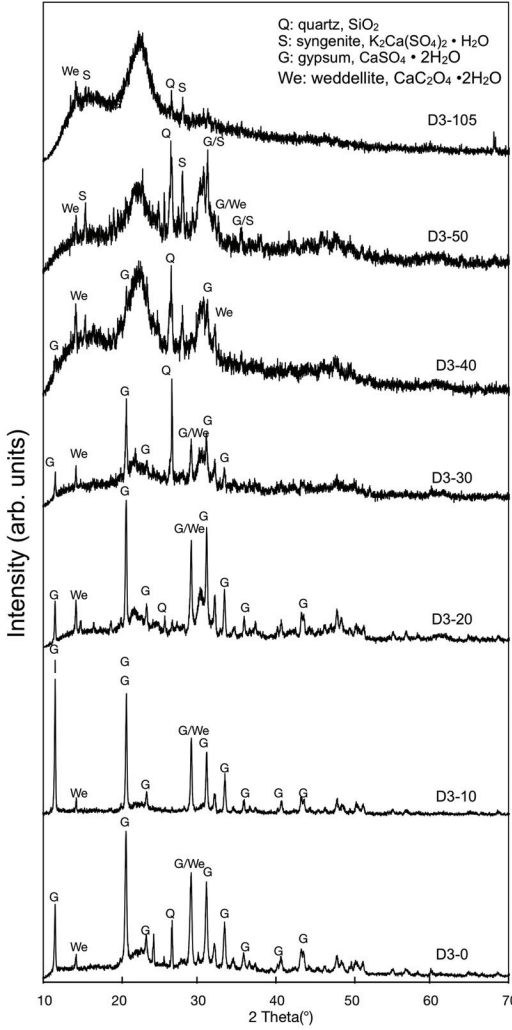
XRD results for pillars E2 and D3 showed significant characteristic peaks belonging to crystalline phases that were not cellulose components(002 crystalline peak at 22°, and 101 amorphous peak between 15–17°). As can be seen in the XRD results for pillar D3(Figure 3), peaks belonging to cellulose components were almost invisible in the lower samples—at 0 and 10 cm—becoming more noticeable with increased sampling height. This showed that as the height from the floor increased, the amount of inorganic crystals attached to the wood gradually decreased.
We were able to assign the characteristic peaks for these samples to gypsum(CaSO4·2H2O) and weddellite (CaC2O4·2H2O), with peaks belonging to the former being more significant than those of the latter.
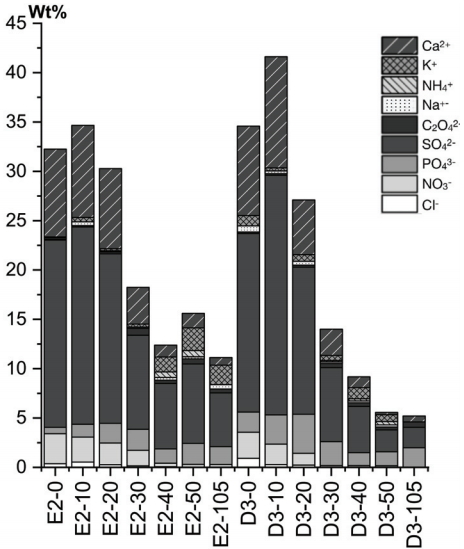
The stacked column graph of the anion and cation content detected through IC analysis showed significantly higher ion content in the wood exhibiting the whitening phenomenon (Figure 4). The total ion content decreased with increased height.
The primary ion contents included cations — mainly Ca2+, followed by K+, NH4+, and Na+—and anions—mainly SO42-, followed by C2O42-, PO43-, NO3-, and Cl-. For both E2 and D3, the total detected ion concentration generally decreased as the sampling height increased, with the detected ion concentrations for samples from 0, 10, and 20 cm higher than the others as 30–45%. The highest values shown by samples E2-10, and D3-10.
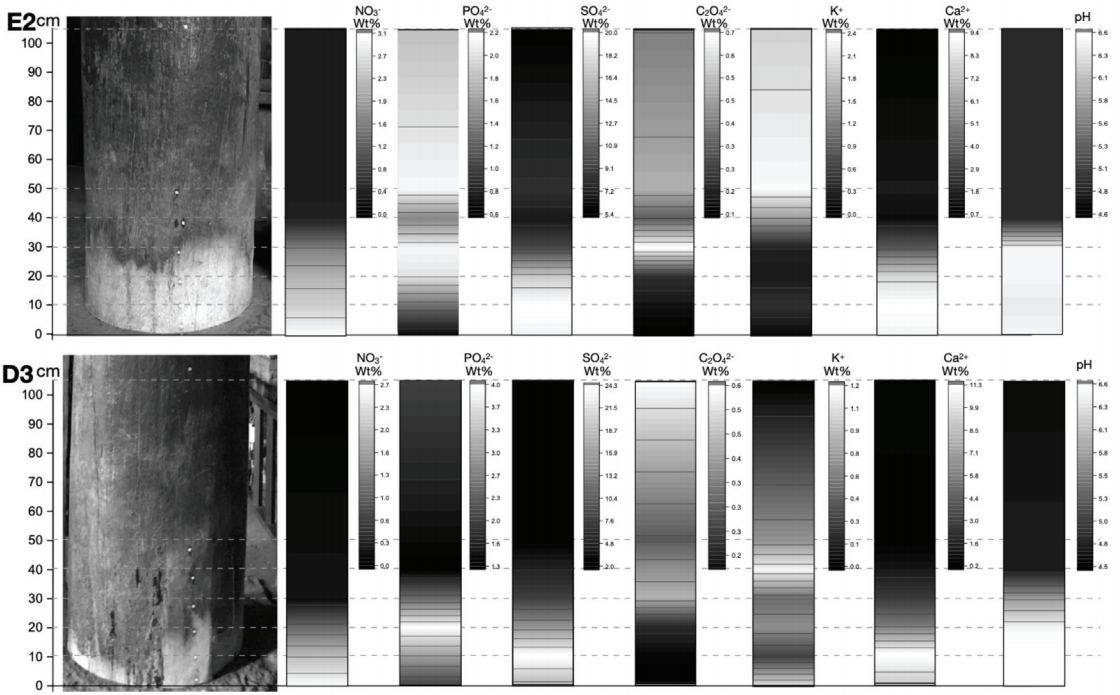
Sample ion concentrations and pHs were plotted against sample height in the form of contour plots, with the black/white rectangular scales representing ion-content levels, growing upwards, from black to white(Figure 5). The photographs presented the areas with noticeable whitening on E2 and D3, and were, respectively, areas from 0–40 cm and 0–30 cm from floor-level. The ion concentration and pH distributions were similar in the whitened areas of both pillars:
1) NO3- ion content decreased as height increased;
2) PO43- ion content reached its maximum in the mid-upper samples;
3) Ca2+ and SO42- ion concentrations and pH values showed similar distributions, being concentrated in mid-lower samples, and decreasing with increased height above 20 cm;
4) pH values for samples taken from under 30 cm ranged between 5.8 and 6.6, and were significantly higher than 105 cm reference point pHs(pH 4.9 for E2-105, and pH 4.9 for D3-105);
5) C2O42- ion content was relatively low in whitened areas —that is, for samples from below 30 cm, and was relatively high in samples from the whitened area upper edges.
Concentration gradients versus height for the different ions indicated a separation process in the wooden pillars. As the transverse sections of the wooden pillars directly contact the stone base, the wooden tissues of the pillars provides a vertical movement route for capillary water. It has been reported that ion-content separation may be caused by the different capabilities of solutes, in terms of their affinities with stationary and mobile phases—which in this case were wood and capillary water(Gaucher, 1969). Thus, a solute suchas NO3-, which may possess a stronger affinity for wood, will stay in the wood tissues as far as the capillary water can move in the wood, while the PO43- ion, with its weaker wood affinity, will be adsorbed and fixed by wood tissues after a certain transport distance(about 20 cm in this study).
In contrast, gypsum(CaSO4·2H2O) and weddellite (CaC2O4·2H2O) were confirmed, along with significant Ca2+ and SO42- ion content, in the whitening phenomenon areas. Gypsum and weddellite solubility are relatively low, according to the Ksp solubility product constants, with CaSO4 reported as 1.95 × 10⁻⁴(at 10℃), and CaC2O4·H2O as 2.57 × 10⁻⁹(at 25℃)(Bolz and Tuve, 1970). The combination of Ca2+ with SO42- and C2O42- ions has allowed solid white gypsum and weddellite to precipitate on the wood tissues. The much lower Ksp solubility product constants for CaC2O4·H2O, compared to CaSO4·2H2O, may explain the low levels of detection of mobile C2O42- ions in the whitened areas. In these areas, mobile C2O42- ions could readily combine with Ca2+ ions, and would barely be detected using the sample preparation method applied in this study.
The significant Ca2+ concentration in the whitening phenomenon area suggested that there must be an external source, or some external factor beneath the wooden pillars, such as their stone bases, the brick floor, or some foundation materials. Although no historical construction records were found, the traditional material, Sanhetu, was probably used in the foundations. Sanhetu is a composite building material consisting of lime, sand, and clay, and was widely used in ancient China, because of its admirable mechanical strength and durability(Dai et al., 2019). Calcium oxide and calcium hydroxide present in Sanhetu may be the primary source of the Ca2+ ions detected in the whitening areas.
Determining the SO42- ion source was more complicated. For example, sulfur dioxide in the atmosphere might be generated from biomass or fossil fuel combustion(Kirchner et al., 2005;Behera et al., 2013) and precipitated into the surrounding environment, or might have come from a building material such as cement, which was probably used in historical repair work. Further investigation will be needed to confirm the SO42- ion source.
In contrast, C2O42- ion may have originated from internal changes in the wood. The C2O42- ion is generated from oxalic acid(OA, C2H2O4), whichisthe simplest dicarboxylic acid and is a strong metal chelator. The free acid of OA, soluble salts, and solid calcium oxalate crystal commonly exist in plants and wood(Häärä et al., 2014). The formation of OA in plants is attributed to enzyme-catalyzed reactions associated with photorespiratory activity(Franceschi, 1987). In wood attacked by wood-rotting fungi, high OA content could originate from enzyme-catalyzed degradation(Clausen et al., 2000; Mäkelä et al., 2002). In studying degradation in iron-contaminated archaeological wood, Almkvist, and Norbakhsh et al. confirmed correlations between hemicellulose fraction degradation, tensile strength reduction, and OA formation (Norbakhsh et al., 2013;Norbakhsh et al., 2014;Almkvist et al., 2016). Accordingly, in our study, the significant amount of weddellite was probably caused by the combination of Ca2+ ions and OA, which may have been the degradation products of wood chemicals.
In wood chemistry, cellulose and hemicellulose are polysaccharides. Upon degradation, they will depolymerize into oligosaccharides and monosaccharides, and then decompose into carbon dioxide and low-molecular organic acids, such as formic acid, acetic acid, or OA(Stamm, 1956;Wyman et al., 2005;Zargari et al., 2015). Therefore, lower pH values are generally considered to characterize more degraded wood.
The whitening phenomenon observed in this study, however, was characterized by the presence of higher pHs, which implied that the calcium hydroxide in Sanhetu could have led to more alkaline capillary water, which in turn caused alkaline degradation of the cellulose, hemicellulose, lignin, and so on, in the wood.
Gypsum and weddellite are colorless or white inorganic minerals, and their precipitation in wood may affect its surface coloration. On the other hand, chemical interactions between solutes in the capillary water and the wood may have also contributed to the color changes.
3.1.2. FTIR analysis
FTIR analysis identified the chemical constituents of the wood. In this study, we saw how the XRD analysis showed the existence of inorganic attachments in the whitening phenomenon areas-and this was also reflected in the FTIR spectra. In order to reduce the influence of the attachments and obtain results which could be representative of the wood’s chemical features, the following procedures were applied to clean the samples:
1) Place ~2 mg of the sample into a centrifuge tube, then add 1 ml of 2% disodium EDTA (ethylenediaminetetraacetate) solution, with a pH of 9, as adjusted using NaOH;
2) Set the centrifuge tube in an ultrasonic cleaning machine, ultrasonicate it for 5 min, then leave it for 1 h;
3) Remove the sample and rinse three times with ultra-pure water;
4) Dry the sample in a hot oven, at 50℃ for 24 h, then set the sample in a desiccator to cool it to room temperature.
The characteristic bands related to wood cell wall structural constituents in the fingerprint region of 1800–400 cm-1 were assigned, using information from the literature and have been summarized in Table 1(Colom et al., 2003;Pandey and Pitman, 2003; 2004; Mohebby, 2005;Naumann et al., 2005;Popescu et al., 2007;Carballo-Meilan et al., 2014).
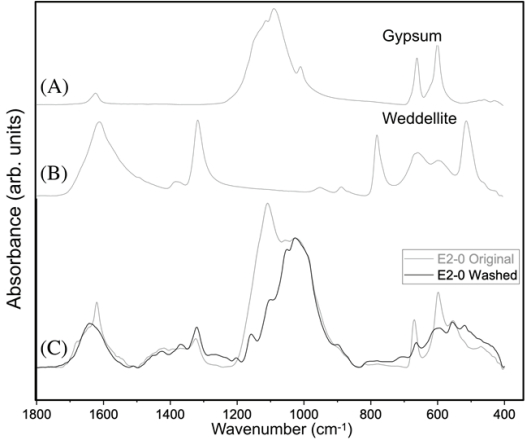
FTIR spectra for weddellite and gypsum, and for E2-0 before and after cleaning(E2-0 Original spectrum before cleaning was normalized with the 1800 cm-1 band set as zero and the 1030 cm-1 band set as one) are shown in Figure 6. Here it can be deduced that, after washing, the interference that originated mainly from the characteristic bands of gypsum has been reduced, and that the main characteristic bands belonging to the chemical composition of wood have become clear. The bands located at approximately 1623 cm-1 and 1317 cm-1, which are most likely due to weddellite, representing symmetric C=O and C=O stretching, respectively (Frost et al., 2003), became very clear.
The cleaning procedure may not have been sufficient to remove weddellite completely from the wood tissues, due to its extremely low solubility.
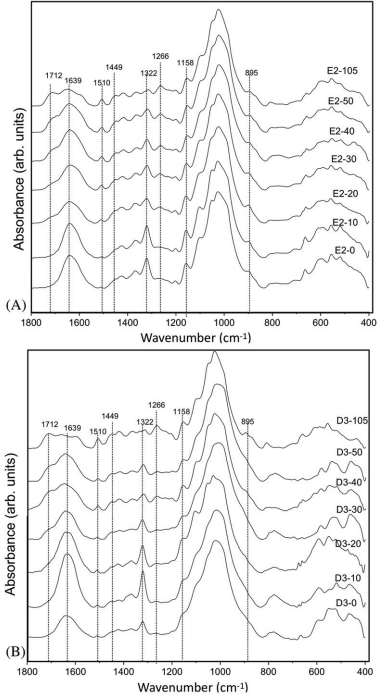
Although no records or scientific investigations of the tree species used in the pillars were found in the literature, FTIR analysis confirmed characteristic bands at 1510 and 1266 cm-1, in the spectra for pillars E2 and D3. These two bands may be assigned to the lignin of softwood. Additionally, FTIR analysis results(Figure 7) also showed different spectral features with decreased sampling height from the floor, especially in the 1780–1130 cm-1 range.
Weddellite-related bands located at approximately 1623 cm-1 and 1317 cm-1 were recognized in the spectra of samples from 0 to 50 cm, and were more significant in samples from below 20 cm. We could also see reduction in the following bands with decreased sampling height, for both E2 and D3:
1) The band between 1750–1670 cm-1, with its peak at 1712 cm-1(unconjugated C=O stretching of the acetyl group of xylans);
2) The band at 1510 cm-1(C=C stretching of the aromatic ring of lignin);
3) The band at 1449 cm-1(the -CH2- pyran ring in lignin and xylan, and the aromatic C-H deformation asymmetric in the -CH3 of carbohydrates);
4) The band at 1266 cm-1(C=O vibration of the Guaiacyl ring of softwood lignin, and C-H and O-H waging of xylans).
Most of these are bands assigned to lignin and hemicellulose(xylan).
For pillar D3, these two bands also showed reduction with reduced sampling height:
1) The band at 1158 cm-1(C-O-C asymmetric stretching of cellulose and hemicellulose); and
2) The band at 895 cm-1(aromatic C-H out-of-plane deformations, and pyran ring vibration of cellulose).
FTIR analyses confirmed more severe wood chemical constituent degradation at lower heights in the whitening phenomenon area of the wood pillar. The degradation of lignin and hemicellulose may have occurred preferentially in pillar E2, while lignin, hemicellulose, and cellulose degradation may have taken place more simultaneously in pillar D3.
Overall, we concluded that FTIR analysis provided supporting evidence for the hypothesis that the generation of weddellite and oxalate ions detected in 3.1.1. was related to the chemical degradation of the wood itself.
3.1.3 The overall situation of whitening phenomenon in the Main Hall
The heights that the whitening phenomenon reached in the 26 measured pillars have been summarized in the form of contour plot, with black/white rectangular scales representing heights, growing upwards, from black to white(Figure 8). It can be seen in the figure that the seven pillars of row E(E3–E9) in the front of the hall and near the doors presented the lowest damage levels-mostly <14 cm-while the pillars in the ninth column, near the eastern wall, presented relative high damage, generally >30 cm.
Based on the XRD and IC analyses, capillary water has been identified as playing a crucial role in the occurrence of the whitening phenomenon, while the better ventilated surroundings of pillars E3 to E9 near the doorway may have limited capillary water activity in those pillars. This capillary water activity has also been associated with salt damage to wall paintings in the Main Hall-which will be the focus of future investigations.
3.2. Surface-damaged areas
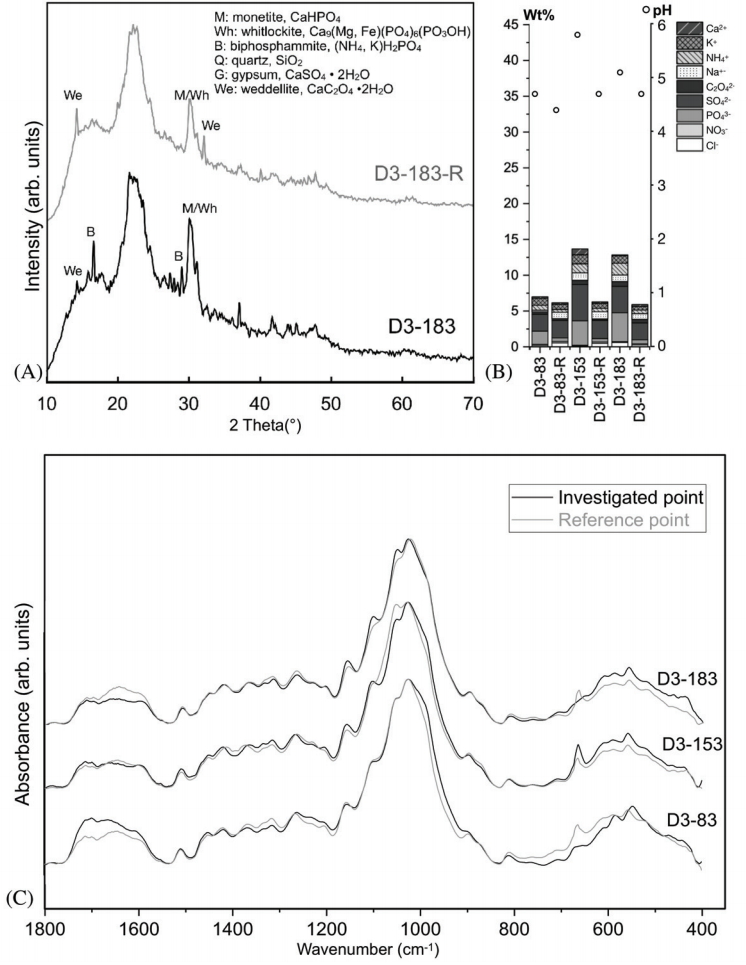
Sample XRD results—in this case for the 183 cm point on pillar D3, and for its corresponding reference point—are shown in Figure 9A. Apart from the characteristic peaks representing the cellulose content in the wood, some minor peaks were produced by XRD analysis, and these were identified as representing biphosphammite[(NH4, K)H2PO4], monetite(CaHPO4), whitlockite[Ca9(Mg, Fe)(PO4)6(PO3OH)], and syngenite[K2Ca(SO4)2·H2O]. The XRD spectrum of the investigated point, D3-183, showed more significant biphosphammite peaks than the spectrum for the corresponding reference point.
Investigated point pH was higher than that of the reference points, while IC results showed a higher total ion content there as well(Figure 9B)—particularly at the points with more apparent surface damage, at the 153 and 183 cm levels. Ions showing significantly higher content included K+, NH4+, SO42-, PO43-, and NO3-. Considering the XRD results, the higher pH and ion content found for the investigated points might have been due to more significant additional inorganic contents.
FTIR spectra for the investigated points at 83, 153, and 183 cm, and their corresponding reference points, have been plotted in Figure 9C, using black and grey lines, respectively. The FTIR analyses were performed with samples cleaned using the procedures mentioned in 3.1. The differences between the investigated and reference point spectra were seen to be slight, making it difficult to assert that the surface-damaged areas had suffered significant chemical changes.
The XRD and IC results revealed the existence of biphosphammite, monetite, and whitlockite-which are bat guano-related minerals(Pryce, 1972;Bridge, 1973;Uchida et al., 2000;Frost et al., 2013)—at higher locations on the pillar. According to the literature, bat colonies once inhabited the Main hall, and were only removed in 2010(Liu, 2010). It has been assumed that physical damage caused by bat activity was one primary factor contributing to the pillar surface-damaged phenomenon.
3.3. FTIR spectra combined with PCA
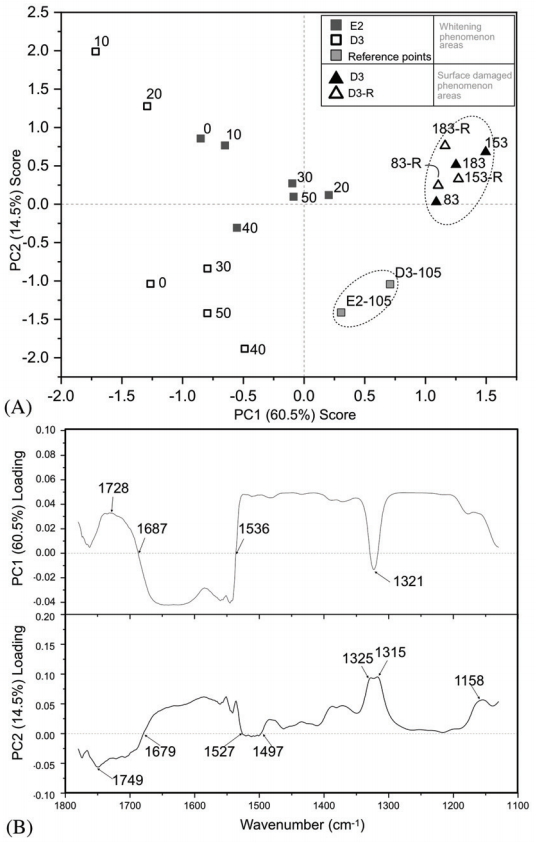
To account for the variations shown by the different sampled points, PCA was applied to the FTIR spectra, for comparison purposes. The PCA was performed for the range 1780–1130 cm-1, since, as noted in the previous section, spectral comparisons showed notable changes to have occurred in this range. The PCA results indicated that the first and second principal components(PC1 and PC2) accounted for 60.5% and 14.5%, respectively, of the variations between the spectra. Subordinate PCs, which accounted for <5%, have not been discussed here.
The plotted scores of PC2 versus PC1(Figure 10A) show the separation of the points. In the surface-damaged areas, sample group points were concentrated in a region with a PC1 score ranging from 1.0–1.5, and a PC2 score ranging from 0.0–1.0. These values applied to both the investigated and reference points, and indicated strong similarity between these samples.
Samples E2-105 and D3-105, which were from reference points, were located in the region with PC1 and PC2 scores ranging between 0.25 to 0.75, and -1.5 to -1.0, respectively, which were some distance from the points that were within the whitening phenomenon area.
The 0-50 cm points for pillars E2 and D3 were roughly scattered in the area where PC1 scored <zero. Among the E2 points, four points between 20–cm were located in the area where the PC1 and PC2 scores were close to zero(PC1: between -0.75 and 0.25, and PC2: between -0.50 and 0.50). The points for E2-0 and E2-10 were located in areas where PC1 and PC2 were lower and higher, respectively (PC1: between -1.00 and -0.50, and PC2: between 0.50 and 1.00).
Similarly, for pillar D3, four points, from 0 cm, and from 30–50 cm, exhibited PC1 scores between -1.25 and -0.4, and PC2 scores between -2.00 to -0.25. In addition, D3-10 and D3-20 points exhibited PC1 and PC2 scores that were much lower and higher, respectively, with PC1 scores ranging between -1.80 and -1.25, and PC2 scores ranging between 1.25 and 2.00.
The PC1 and PC2 loadings plotted with wavenumbers provided information on the bands responsible for the sample groupings(Figure 10B). The PC1 loading showed just two significant negative bands-with one being a significant broad band from 1657–1536 cm-1, and the other being a minor sharp band, with a peak at 1321 cm-1.
For surface-damaged area points, the positive PC1 scores contributed the most to their significant separation from the other whitening area points. Bands assigned to the symmetric C=O and C=O stretching in weddellite(CaC2O4·2H2O) were plotted at approximately 1623 cm-1 and 1317 cm-1, respectively, in the FTIR spectrum. The absence of weddellite might have been the main reason why the surface-damaged phenomenon area points, and the E2-105 and D3-105 reference points, were grouped on the positive side of the PC1 score.
The PC2 loadings exhibited the most noticeable positive doublet, with peaks at 1329 and 1317 cm-1, followed by the band ranging from 1679–1527 cm-1, and the band with a 1158 cm-1 peak. It was also noticeable that there were only two negative ranges, which included a relatively significant range in a broad band extending from 1780–1679 cm-1, and a minor range extending from 1527–1497 cm-1.
The characteristic bands in the FTIR spectrum belonged to weddellite, as mentioned above, and the bands assigned to the C-O-C asymmetric stretching of cellulose and hemicellulose around 1158 cm-1 were found in the positive PC2 range. The characteristic band belonging to the unconjugated C=O stretching of an acetyl group in xylans, at 1750–1670 cm-1, and the band assigned to the C=C stretching of the aromatic ring of lignin, at 1510 cm-1, were found in the negative PC2 range.
The reference points E2-105 and D3-105, which were less affected by external factors such as the floor or bat guano, presented negative PC2 value, and were clearly separated from the surface-damaged phenomenon points, which showed positive PC2 values. The PC2 loadings suggested that the band for xylans, at 1750–1670 cm-1, and the bands representing lignin, at 1510 cm-1, may have contributed negatively to the PC2 scores, meaning that the xylans and lignin of the surface-damaged phenomenon points may be more degraded.
Whitening phenomenon area points could be roughly grouped by their PC2 scores. The higher PC2 scores(E2-0, E2-10, D3-10, and D3-20) may be primarily attributed to weddellite existence and lignin degradation. Although D3-0 and D3-105 both presented PC2 scores of approximately -1, the causes were different, according to their PC1 values and their loadings. The former was mainly attributable to the less significant weddellite-related bands located at ~1623 cm-1 and 1317 cm-1, along with the band at 1159 cm-1, which was related to reduced cellulose. In contrast, the latter was attributed mainly to the absence of the weddellite-related band, and to the less reduced xylans-related band, at 1750-1670 cm-1.
The PC2 score for D3-0 indicated that the amount of calcium oxalate attachment may not be high in direct proximity with the floor. As summarized in 3.1.1, Ca2+ ions were concentrated in mid-lower part of the whitening phenomenon area, rather than right at the bottom, supporting the hypothesis that calcium oxalate precipitation was more likely in areas rich in calcium ions.
4. CONCLUSIONS
We investigated the wood whitening and degradation phenomena in the Main Hall of the Fengguo monastery in Yixian county, Liaoning province, China, and have been able to identify some of their characteristics and likely causes.
Regarding the whitening phenomenon, the higher pH, the existence of gypsum and weddellite, and the significant ion content, as well as the specific FTIR spectral features, implied that this phenomenon may be attributed to the precipitation of solutes in capillary water, and to the degradation of wood chemical constituents under alkaline conditions. We have speculated that alkaline mixtures—which include a high calcium content, and which originate from under the stone floor—may be responsible, although this requires additional study before it can be confirmed. Future research into this phenomenon will focus on the following:
1) Capillary water activity in the Main Hall;
2) The exact sources of the solutes found in the capillary water;
3) The influences of this phenomenon on the interior and physical properties of wood;
4) The applicable wood degradation mechanism and its mitigation.
With respect to the surface-damaged phenomenon, FTIR analysis found no valid evidence of chemical degradation. Detection of bat guano-related material implied that the surface damage may be primarily attributable to physical damage stemming from bat activities over a prolonged period. The residual effects of bat guano on wooden construction are not yet clear, and although the bats were removed almost 10 years ago, monitoring for ongoing surface damage is necessary, in order to obtain better understanding of its progress and likely further development.