Microstructural Analysis of Slags using Raman Micro Spectroscope
Article information
Abstract
The metal-manufacturing method and smelting temperature of ancient metal-production processes have been studied by analyzing the principal elements and microstructures of slag. However, the microstructure of slag varies according to the solidification cooling rate and types and relative amounts of various oxides contained within the smelting materials. Hence, there is a need for accurate analysis methods that allow slag to be distinguished by more than its composition or microstructure. In this study, the microstructures of slag discharged as a result of smelting iron sands collected from Pohang and Gyeongju, as well as the slag excavated from the Ungyo site in Wanju, were analyzed by using metalloscopy, scanning election microscopy-energy dispersine X-ray spectroscopy(SEM-EDS) and wavelength dispersive X-ray fluorenscence(WD-XRF). Furthermore, the microcrystals were accurately characterized by performing Raman micro-spectroscopy, which is a technique that can be used to identify the microcrystals of slags. SEM-EDS analysis of Pohang slag indicated that its white polygonal crystals could be Magnetite; however, Raman micro-spectroscopy revealed that these crystals were actually ulvöspinel. Raman micro-spectroscopy and SEM-EDS were also used to verify that the coarse white dendritic structures observed in the Gyeongju-slag were Wüstites. Additionally, the Wanju slag was observed to have a glassy matrix, which was confirmed by Raman micro-spectroscopy to be Augite. Thus, we have demonstrated that Raman micro-spectroscopy can accurately identify slag microcrystals, which are otherwise difficult to distinguish as solely based on their chemical composition and crystal morphology. Therefore, we conclude that it has excellent potential as a slag analysis technique.
1. INTRODUCTION
Raman micro spectroscope is one type of Raman spectroscope that employs a Raman spectrometer and an optical microscope, and it is capable of analyzing even trace amounts of samples. Raman micro spectroscope can be used to identify the structure of materials using trace amounts of sample material and it is useful for research into cultural heritage materials because it is a nondestructive analysis method(Park et al., 2011).
In country, research has been conducted on the properties of various materials using Raman micro spectroscope for the identification of pigment elements(Lee, 2015) and analys is of corrosive compounds on bronze objects(Park et al., 2011; Lee et al., 2012; Kim and Jeong, 2015). In addition, it has been demonstrated that if the compounds and microstructures can't be determined by scanning electron microscopy-energy dispersive X-ray spectroscopy(SEM-EDS) or wavelength dispersive X-ray fluorenscence(WD-XRF) analyses, which have been used to identify corrosive compounds, Raman spectroscope can be used to analyze them accurately(Lee et al., 2012; Kim and Jeong, 2015).
Furthermore, in country, ancient metal-production processes have been investigated using various slags excavated from metal-production sites, and the iron manufacturing method and smelting temperature have been studied by analyzing the principal elements and microstructures of slags(Kang, 2009; Choi, 2017; Lee, 2017; Bae, 2018). However, the microstructure of slag varies with the types and relative amounts of various oxides contained in the smelting materials, as well as with the cooling rate during solidification. Hence, there is a need for accurate analysis methods to overcome the current limitations of being able to distinguish slag only by its composition or microstructure.
Therefore, in this study, the microstructures of slags discharged from iron smelting processes conducted on iron sands collected from Gyeongju and Pohang and the slags excavated from the Ungyo site in Wanju, Jeollabuk-do (Three Kingdoms Period, AD 3C) were analyzed through SEM-EDS and WD-XRF. In particular, the microcrystals, which are otherwise difficult to distinguish, were accurately characterized by Raman micro spectroscope. The findings presented herein will be useful for identifying the microcrystals of slags and characterizing metal-production sites.
2. MATERIALS AND METHODS
2.1. Samples
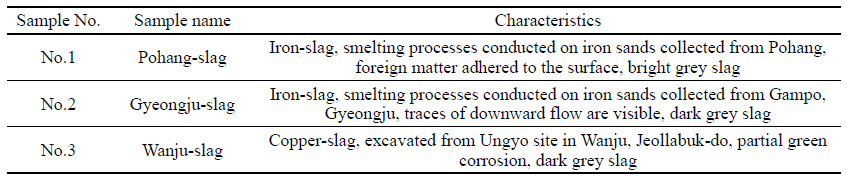
The samples analyzed in this study were slags discharged from smelting processes conducted on iron sands collected from Gyeongju and Pohang and the slags excavated from the Ungyo site in Wanju, Jeollabuk-do(Table 1, Figure 1). The analyzed compositions and microstructures of the slags discharged from the smelting processes conducted on two types of iron sands and the slag excavated from the Ungyo site in Wanju, Jeollabuk-do. In particular, microcrystals that are otherwise difficult to distinguish were accurately identified by Raman micro spectroscopy.
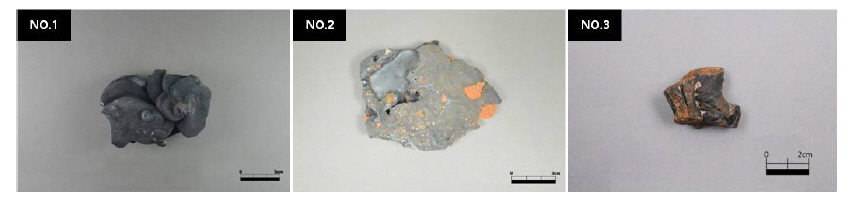
Slag samples. (Left) Smelting processes on iron sands collected from Pohang, (Middle) Smelting processes on iron sands collected from Gyeongju, (Right) Excavated from copper smelting site at Wanju.
List of sample
2.2. Research methods
2.2.1. Principal component analysis
With the powdered samples, the principal component analysis of each sample was conducted using wavelength dispersive X-ray fluorescence spectrometry(S4 Pioneer, Bruker AXS GmbH, Germany). The power was 4 kW, the ATM was Helium, the sample preparation used a liquid cup, and the sample mask was 34 mm.
2.2.2. Microstructure and chemical composition
A portion of the sample was obtained by cutting with a diamond grinder, taking care to prevent foreign matter from adhering to it. The specimens were mounted on an epoxy resin, polished sequentially from 220 mesh to 4000 mesh, and then finely polished with 3-μm and 1-μm DP-Suspension P(Struers, Denmark) . The microstructures of the pretreated samples were observed with a metallurgical microscope (DM-2500M, Leica, Germany). The microstructures and chemical composition of microsites in the microstructures were analyzed by SEM(MIRA3, TESCAN, Czech) and EDS(QUANTA300, BRUKER, Germany). The sample was then coated with platinum to increase its conductivity while minimizing the effect on the composition ratio.
2.2.3. Raman micro spectroscopy
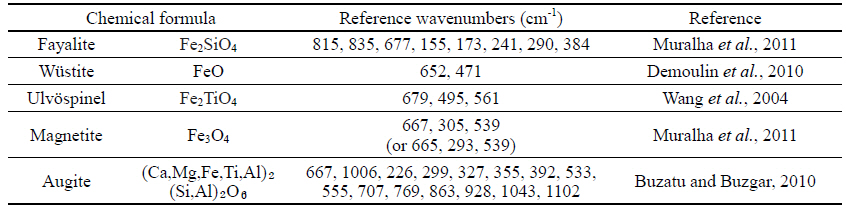
Raman micro spectroscope[LabRamARAMIS, Horiba Jobin- Yvon, France (He-Ne laser, 633 nm)] was conducted to examine the microcrystals of the slags, which were then accurately identified by comparison with reference Raman shifts(Table 2).

List of reference Raman shift
3. RESULTS AND DISCUSSION
3.1. No.1 Pohang-slag
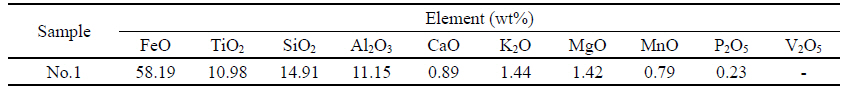
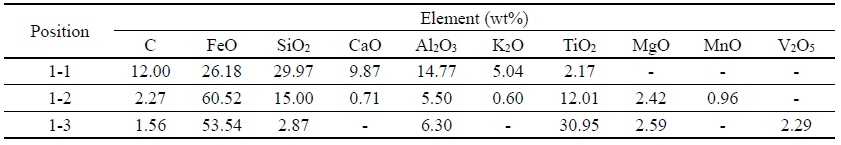
Table 3 show the WD-XRF results of No.1 Pohang-slag revealed FeO(58.19 wt%) and TiO2(10.98 wt%) and other compounds including SiO2, Al2O3, CaO, K2O, MgO, MnO and P2O5. Metallurgical microscopy images(Figure 2) revealed greyish-white long columnar structures in the background, a glassy matrix, and numerous white polygonal structures. Figure 3 and Table 4 show the SEM-EDS results of Pohang-slag. In Figure 3, 1-1 is a glassy base matrix with high contents of FeO (26.18 wt%), SiO2(29.97 wt%) and Al2O3(14.77 wt%); 1-2 is a long columnar structure in the background, which appears to be Fayalite and has high contents of FeO(60.52 wt%) and SiO2 (15.00 wt%); and 1-3 is a white polygonal structure. In previous studies, the white polygonal crystals observed in such microstructures of slags were mostly identified as Magnetite; however, SEM-EDS results indicated a higher content of TiO2 in these crystals. Hence, Raman micro spectroscope was conducted for more accurate identification. Furthermore, the long columnar structures in the background, which were thought to be Fayalite, were analyzed via Raman micro spectroscope. From the Raman micro spectroscope for Pohang-slag, Raman shifts of 489 and 680 cm-1 were detected in the white polygonal structure(Figure 4, 5), which coincide with the Raman shifts of Ulvöspinel(Table 2). In the long columnar structure in the background, Raman shifts of 296, 384, 817, and 841 cm-1 were detected (Figure 6, 7), which coincide with the Raman shifts of Fayalite(Table 2).
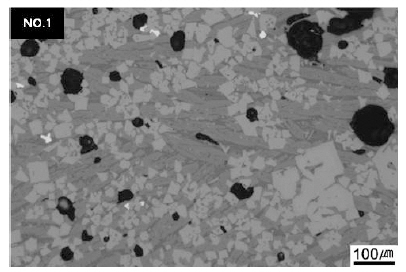
Microstructure of No.1 Pohang-slag(×100).
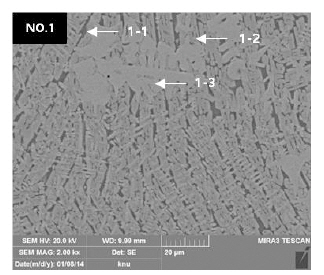
SEM image and points of EDS analysis of No.1 Pohang-slag.
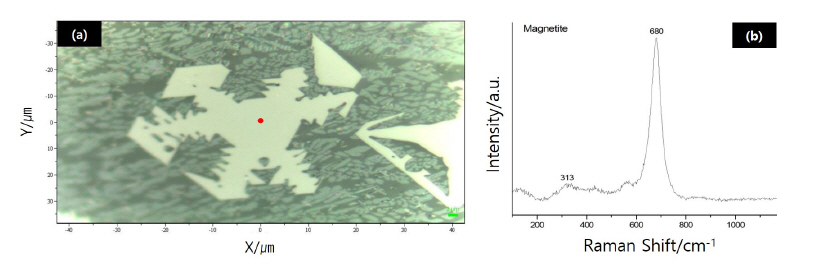
Raman micro spectroscopy results for No.1 Pohang-slag(Magnetite). (a) Image of area in which the spectrum(b) was collected.
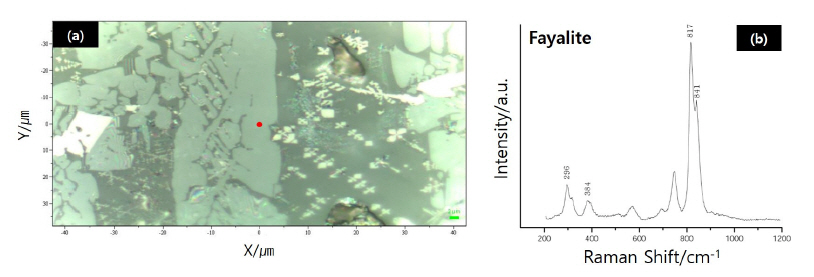
Raman micro spectroscopy results for No.1 Pohang-slag(Ulvöspinel). (a) Image of area in which the spectrum( b) was collected.
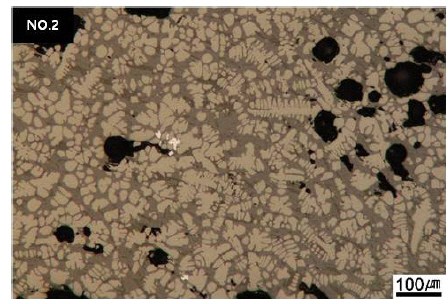
Microstructure of No.2 Gyeongju-slag(×100).
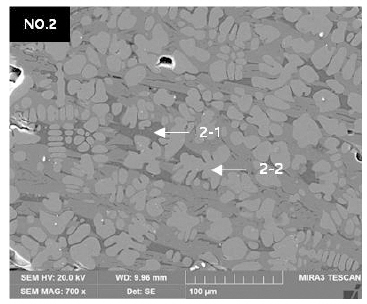
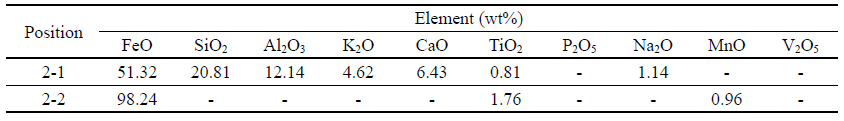
SEM image and points of EDS analysis of No.2 Gyeongju-slag.

WD-XRF results of No.1 Pohang-slag
EDS results for No.1 Pohang-slag
3.2. No.2 Gyeongju-slag
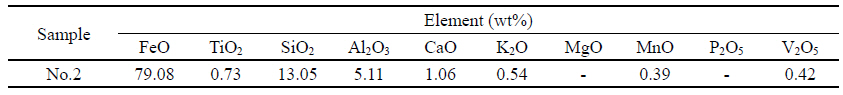
Table 5 is WD-XRF analysis of No.2 Gyeongju-slag revealed FeO(79.08 wt%), TiO2(0.73 wt%) and other compounds including SiO2, Al2O3, CaO, K2O and MnO. Metallurgical microscopy images(Figure 6) revealed a broad distribution of greyish-white long columnar structures, with glassy matrices between them. In addition, coarse white dendritic structures were distributed. Figure 7, Table 6 show the SEM-EDS results for No.2 Gyeongju-slag. In Figure 7, 2-1 is a glassy matrix with high contents of FeO(51.32 wt%), SiO2(20.81 wt%) and Al2O3(12.14 wt%); and 2-2 is a white coarse dendritic structure with FeO(98.24 wt%) and TiO2(1.76 wt%), which is presumably wüstite. For more accurate identification of the microstructure, Raman micro spectroscope was conducted on No.2 Gyeongjuslag. A Raman shift of 646 cm-1 was detected in the white polygonal structure(Figure 8), which coincides with a Raman shift of Wüstite(Table 2).
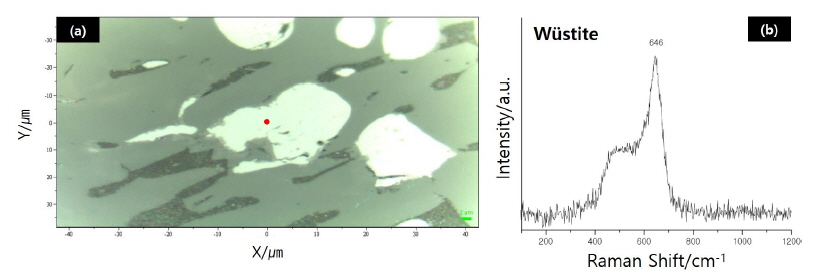
Raman micro spectroscopy results for No.2 Gyeongju-slag(Wüstite). (a) Image of area in which the spectrum(b) was collected.

WD-XRF results of No.2 Gyeongju-slag

EDS results for No.2 G-slag
3.3. No.3 Wanju-slag
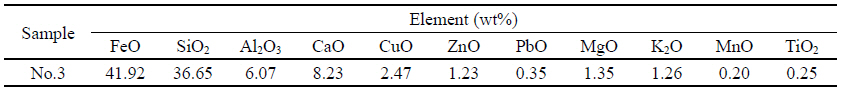
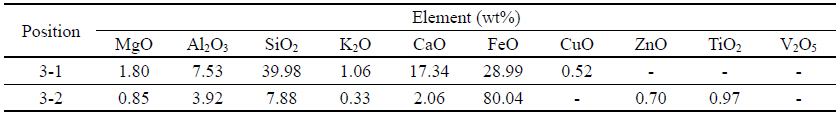
Table 7 is WD-XRF analysis of No.3 Wanju-slag revealed high contents of FeO(41.92 wt%) and SiO2(36.65 wt%), and other compounds including Al2O3, CaO, CuO, ZnO and PbO. Metallurgical microscopy images(Figure 9) revealed white dendritic structures inside a boundary of long columnar structures. The base matrix was observed to be glassy. Table 8, Figure 10 show the SEM-EDS results for No.3 Wanju-slag. In Figure 10, 3-1 is a base matrix with an Al2O3 content of 7.53 wt%(which is lower than that in the general glassy matrix) and a CaO content of 17.34 wt% (which is higher); 3-2 is a dendritic structure of which 80.04 wt% is FeO, and it is thought to be Magnetite. Raman micro spectroscope was conducted to unambiguously identify each microcrystals white in No.3 Wanju-slag. Raman shifts of 315, 379, 529, 659, 770, 925, and 1005 cm-1 were detected in the base matrix(Figure 11), which coincides with the Raman shifts of Augite(Table 2). The white dendritic structure was identified as Magnetite via the SEM-EDS analysis. This was confirmed by Raman micro spectroscopy measurements, in which Raman shifts of 313 and 680 cm-1 were detected(Figure 12) that coincide with the Raman shifts of Magnetite(Table 2).

Microstructure of No.2 Wanju-slag(×100).

SEM image and points of EDS analysis of No.2 Wanju-slag.
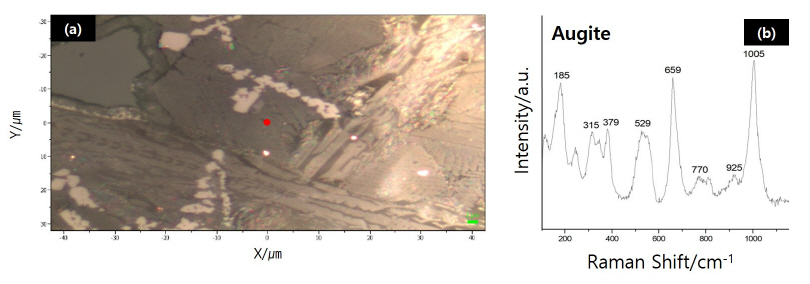
Raman micro spectroscopy results for No.3 Wanju-slag(Augite). (a) Image of area in which the spectrum(b) was collected.
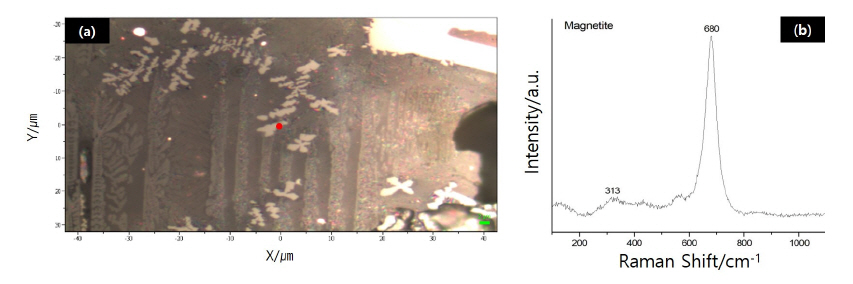
Raman micro spectroscopy results for No.3 Wanju-slag(Magnetite). (a) Image of area in which the spectrum(b) was collected.

WD-XRF results of No.3 Wanju-slag

EDS results for No.3 Wanju-slag
4. CONCLUSIONS
Previously reported studies on the microstructures and compounds excavated in ancient metal-production sites in country principally used XRD, SEM-EDS and XRF. However, there were many difficulties in accurately identifying the microcrystals with these methods. Therefore, in this study, microstructures of slags discharged from smelting processes(No.1 Pohang-slag, No.2 Gyeongju-slag) and the slags excavated from the Ungyo site in Wanju, Jeollabuk-do (No.3 Wanju-slag) were clearly analyzed using Raman micro spectroscope.
White polygonal crystals in the microstructures of No.1 Pohang-slag. In previous studies, these crystals were identified as Magnetite; however, SEM-EDS results indicated a greater content of TiO2 compared to Magnetite. Raman micro spectroscopy confirmed these white polygonal crystals to be Ulvöspinel. Next, Dendritic structure in No.2 Gyeongju-slag, identification was confirmed by Raman micro spectroscopy. Lastly, No.3 Wanju-slag indicated a white dendritic structure, which was presumed to be a glassy matrix. However, SEM-EDS analysis indicated a content of oxides for this sample that differs from that of a typical glassy matrix. Furthermore, Raman micro spectroscopy results revealed that these structures were not glassy matrices, but Augites.
The results of this study confirm that Raman micro spectroscope can accurately identify the microcrystals of slags, which are otherwise difficult to distinguish only by their compositions and crystal morphology. Hence, this technique, which has only had limited use thus far in cultural artifact research in country, is highly promising for slag analysis. However, the present study represents only the start of a larger effort to generate reliable standard Raman shift results for slag analysis. If sufficient standard data is obtained via the on going research, Raman micro spectroscope can be widely used to identify microcrystals found in slag compounds at metal production sites, and thus the nature of these sites can be fully understood.
ACKNOWLEDGEMENTS
This work was supported by a National Research Foundation of Korea(NRF) grant funded by the Korea government(No. NRF-2016R1D1A2B03936071).