


1. INTRODUCTION
Black ware, porcelain with black glaze, originated in Song dynasty in China and became popular throughout Yuan dynasty. They were produced in Jianyao and Hongtangyao in Fujian; Jizhouyaa and Qilizhenyao in Jiangxi; and Cizhou yao in Hubei. In general, black ware called “Tenmoku” in Japan. A Buddhist monk who climbed the Chinese Tianmu mountain coined the word “tenmoku” for the cup brought home. These porcelain products were prepared in the Seto region and their glaze was known as “Tenmoku glaze”(Jung, 2001).
In Korea, black ware was produced with celadon in kilns around Jeolla–do. During the Joseon dynasty, they were produced with other ceramics such as Buncheong ware or white porcelain in a kiln(Kim, 2013). During the Goryeo dynasty, a variety of black ware―polished, stained, and containing opaque colors, e.g., red and tan―appeared. By the late Joseon dynasty, black ware using seokanju was prepared and widely used(Seo, 2011). At present, a total of 41 types of black ware kilns have been confirmed in South Korea, most of which have been confirmed through the investigation of the Earth’s surface. Although no detailed classification or study has been carried out on domestically originated black ware, black ware from 11 sites has been studied in ceramic history(Seo, 2011).
The kilns, which were produced by applying black glaze on white porcelain body, were excavated at the sites of Gapyeong-gun Hapan-ri in Gyeonggi-do, Eumseong-gun Dongum-ri in Chungcheongbuk-do and Yeongdong-gun Hangok-ri in Chungcheongbuk-do. The purpose of this study is to confirm the manufacturing technique of black ware found in the Jeolla region through scientific analysis of the black ware excavated from the white porcelain kiln in Yongyeon-ri, Damyang. In addition, black ware samples are compared in terms of their raw materials and locations of their excavation sites such as Damyang Yongyeon-ri, Gilmyeong-ri Pocheon-si(Koh and Kim, 2008), and Bonggok kiln site in Jinan-gun(Park and Chung, 2016) as well those produced in China but found in Korea such as in the Shinan shipwreck(Park et al., 2019). This comparison was carried out by component and statistical analysis methods that determine the colorant state of the coloring agent.
2. MATERIALS AND METHODS
2.1. Materials of study
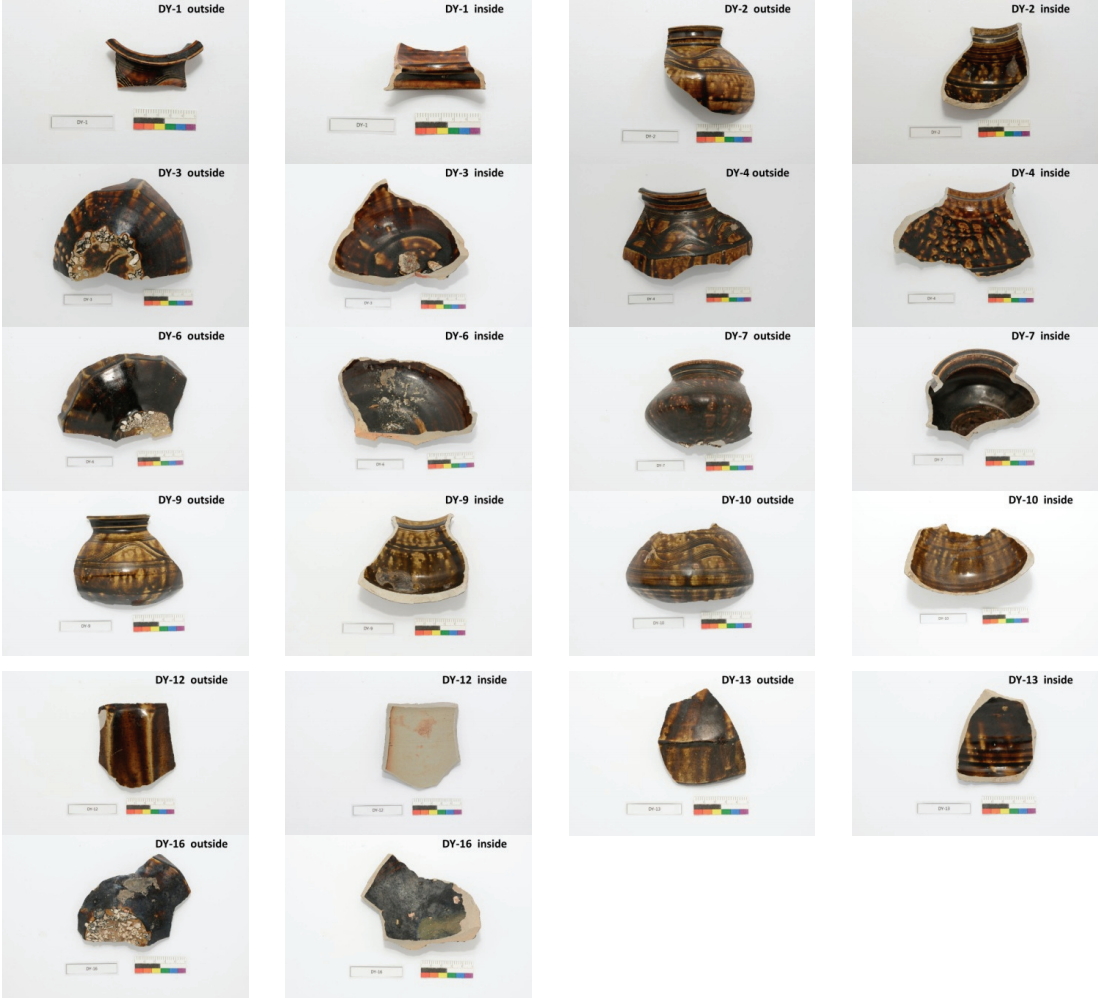
Black-glazed ware samples were excavated from Yongyeon-ri, Damyang. The kiln sites are located at Mt. Yongyeon-ri, Yongmyeon, Damyang-gun, Jeollanam-do. The Institute of the Nations Cultural Heritage conducted the excavation from May 18 to October 31, 2015. Two kilns and two waste sites were identified during the Joseon dynasty, and white porcelain samples painted in underglaze iron-brown, black wares, and white porcelains were excavated(Institute of Nation’s Cultural Heritage, 2018). Among these, 11 black ware samples were selected for study. The details of these samples are presented in Table 1 and Figure 1.
2.2. Methods
2.2.1. Color measurement
Color measurement is useful for studying the firing environment of porcelain and its production area because porcelain color is affected by the firing temperature, time, atmosphere, and the chemical composition of the body(Piero and Patrizia, 2004).
Among the methods of color marking in the Korean Industrial Standards (KS), the color difference was calculated using the CIE LAB color space represented by a*(green – red), b*(yellow – blue) and L*(brightness) corresponding to KS A 0067. All measurements were made using a spectrophotometer(CR-400, Minolta, JPN). To reduce errors, the black-glazed portions were selected and measured three times in all, avoiding discoloration or contamination in the of sherds.
2.2.2. Absorption rate and Apparent porosity
The absorption rate and apparent porosity were measured and analyzed to compare the physical properties of the porcelain material. The measurements were made using a semi-micro analytical balance(GR-200, A&D, JPN) and density determination kit(AD-1653, A&D, JPN).
To measure the physical properties of bodies, the surface glazing layer was ground and a dry weight of W1 was obtained at 100±5°C among two days. After depositing it in distilled water for two days, the water was wiped off the surface and its weights in air and underwater were measured as W2 and W3, respectively. Thereafter, the absorption rate and apparent porosity were obtained using the following formulas:
2.2.3. Crystal structure analysis of minerals
The crystallographic analysis of mineral composition was carried out using an X-ray diffractometer(MiniFlex 600, Rigaku, JPN), and the measurement conditions were 40 kV, 40 mA, 5–60°, and 0.019°/32 s.
2.2.4. Cross-section observation
Samples were cut into cubes, stuck with epoxy resin to grind sections using polishing(Rotopol-11, Struers, DNK) and sand paper #500, #1200, #2400, and #4000 in this order, and then machined with a mirror surface using an abrasive solution. A metallurgical microscope(Epiphot 200, Nikon, JPN) was used to observe the layer properties of the sherd.
2.2.5. Major element analysis
The contents analysis of major element was performed by scanning electron microscopy (SEM)(EM-30AX, COXEM, KOR) and energy-dispersive spectroscopy (EDS)(X-Stream-2/micsF+, Oxford, GBR).
When analyzing the components of the bodies, we avoided pores and parts containing a large amount of certain ingredients like unusual particle. Because element analysis may vary depending on the location, an analysis of the appropriate location was performed by referring to microscopic cross-section images. A total of three measurements were conducted and the average value was used.
2.2.6. Minor element analysis
The contents analysis of minor elements was performed using inductively coupled plasma mass spectrometry(OPTIMA 4300DV, PerkinElmer, USA). The major elements were converted into their oxide after analyzing nine elements except Si. The analysis was conducted on 33 minor elements(Rb, Ba, Sr, Co, Cr, Cu, Ni, Sc, Zn, Y, Cs, La, Ce, Pr, Nd, Sm, Eu, Gd, Tb, Dy, Ho, Er, Tm, Yb, Lu, Pb, Th, U, Mo, Ga, Li, V, and Zr). The measurements were analyzed and verified through comparison with the standard sample for calibration(BGR-1, SCO-1, SDC-1) and the conditions were set under RF frequencies of 40.68 MHz and 27.12 MHz and RF power of 1,300 W.
2.2.7. Principal component analysis
Principal component analysis and discriminant analysis which are one of the statistical analysis methods, were used for statistical analysis—performed using the major compositions of the body and glaze. Seven oxides(SiO2, Al2O3, Fe2O3, CaO, K2O, TiO2, and MnO) were used as variables to compare with elements of black wares excavated from other sites.
The principal component analysis method is an analysis method that compresses data with many variables into major components by considering their inter-parameter associations. This implies the representation of multidimensional data in low-dimensional space with minimal loss of information(Son, 2018).
The method first equates the variances of variables through data standardization. Next, it determines the relationship between the variables by calculating the correlation matrix between them. Then, it calculates the eigenvalues and eigenvectors through the correlation sequence. Excel macro, which calculates the eigenvalues and eigenvectors, was downloaded from the GitHub repository provided by Wikibooks(GitHub, 2019). Using eigenvectors, standardized data are moved to the principal component space. The converted value is called the principal component score, which indicates the value of the compressed variable(Son, 2018).
3. RESULT
3.1. Color coordinates
The color differences of black ware depend on the firing temperature and the environment. In the process of firing, the environment induces a variety of reactions. The difference between the chemical constituents of the body and the mineral crystals that appear owing to the firing temperature is used for classification through appearance(Piero and Patrizia, 2004).
As the excavated points and ware types are the same in the case of black-glazed ware excavated from Yongyeon-ri, as shown in Figures 2 and 3, it is assumed that the bodies were exposed to similar firing environments. No other features were dependent on the excavated point. The uneven distribution of colors at the surface layer is attributed to the thickness and flow of the glaze, making it difficult to identify any meaningful correlation using this feature.
The interior of the sample DY-12 has a particularly high brightness value, owing to few glazing layers, thus the color of the body influence to its value.
3.2. Absorption rate and Apparent porosity
The absorption rate and apparent porosity were observed within 3% for most excavated black ware. However, the DY-1 and DY-2 fragments showed absorption rates and apparent porosity rates of more than 5%. The DY-1 and DY-2 fragments also do not deviate from the absorption rate and apparent porosity of common porcelain. However, the excavated points of these two samples are a kiln, so it can be assumed that there was a influence in the partial firing environment of the kiln(Figure 3).
3.3. Cross-section observation
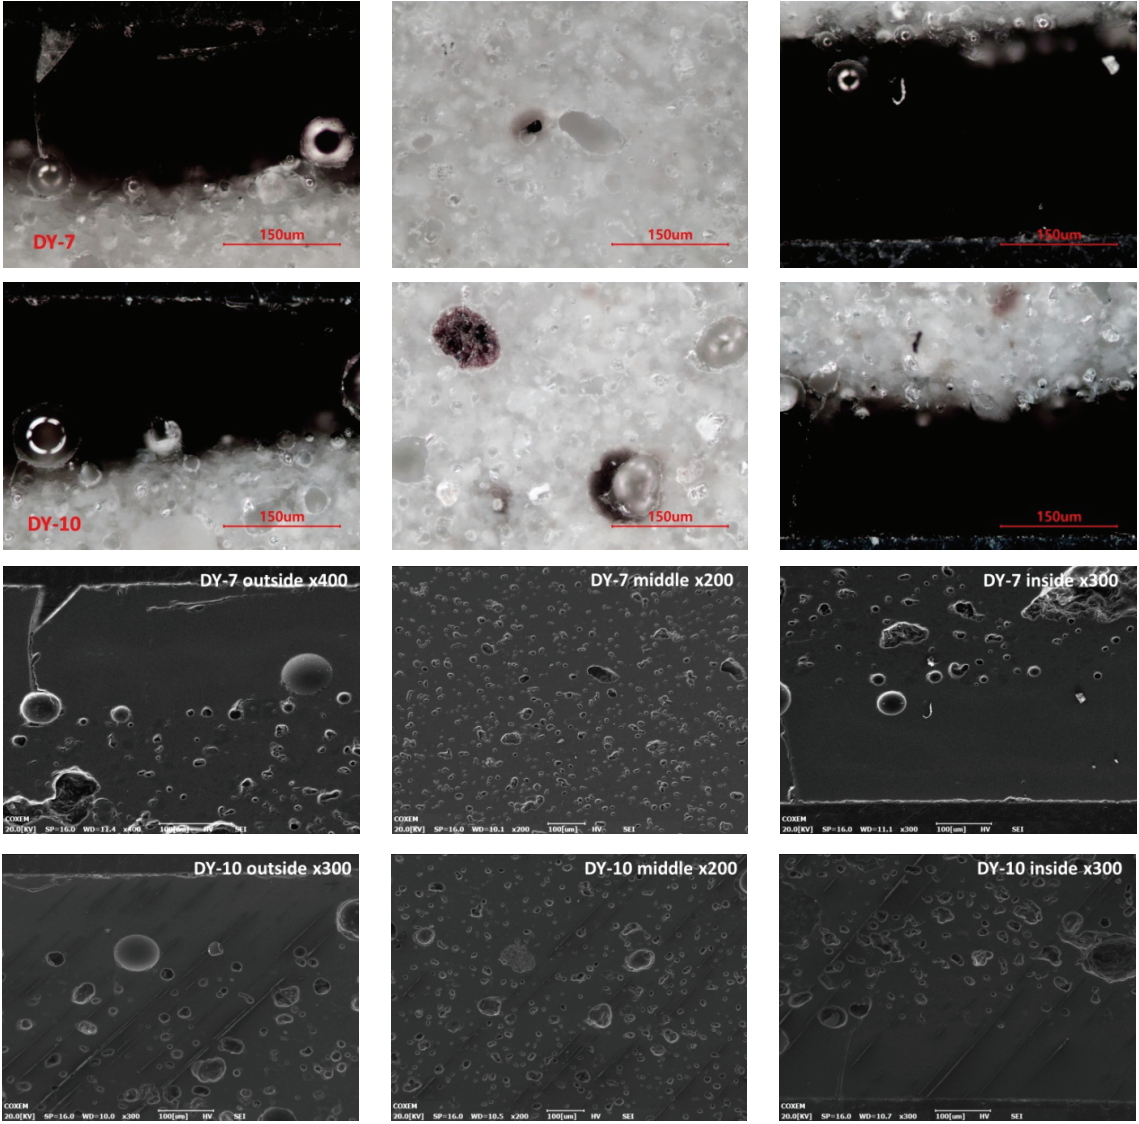
A analytical microscope was used to observe the amount and shape of bubbles. In order to determine the presence, distribution and type of raw minerals and secondary minerals, they were analyzed at high magnification using a scanning electron microscope combined with EDS.
Regardless of the excavated points, the black wares excavated at Damyang Yongyeon-ri were observed a homogeneous black-glazed layer in the optical microscope images instead of a red, orange or black iron oxide crystals-(Figure 4). Also, they did not present the acicular structure, dendritic structure, or coagulation patterns of iron oxide in the scanning electron microscope image(Figure 5).
The body of the black ware was identified to contain black and red particles in quartz crystals. The black particles observed in DY-7 are estimated to contain ilmenite(FeTiO3), because the amounts of Ti and Fe are similar. The red particles observed in DY-10 are composed of Fe; it is thus assumed to be iron oxide. Many pores were identified identified between the body and the glaze layers, similar to typical porcelain. Most of its bodies are observed in white color and formed vitrified.
The glaze layer of the DY-9 fragment had observed a spot of red color in visiable method. The components were analyzed at that spot, but compared to the other spots, the average value of most elements content was similar and did not exceed the standard deviation. This phenomenon is not caused by the color development due to the high or low content of components, but due to the inhomogeneity of specific components according to the pores or their distribution(Eo and Lee, 2013). That is, it is estimated by the difference by scattering and refraction of light by pores.
3.4. Mineral composition analysis
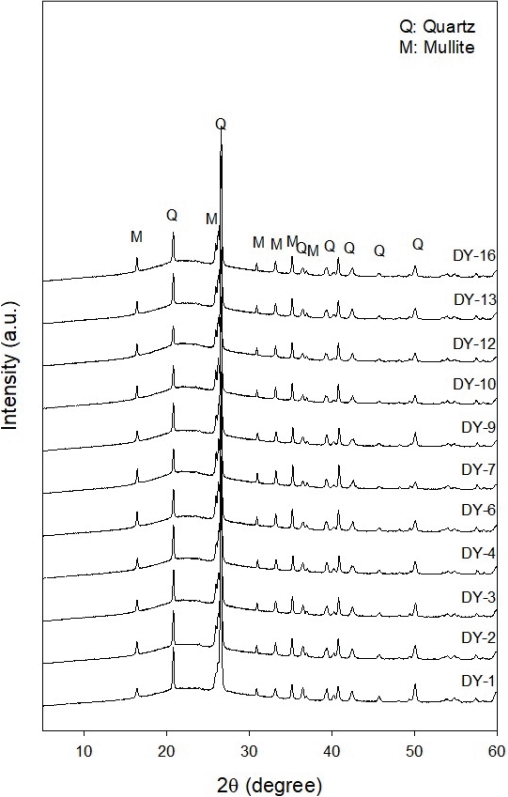
The mineral composition of the excavated porcelain ware was identified through X-ray diffraction analysis. It was found that quartz and mullite were common in the samples. Mullite begins to produce primary mullite at approximately 1,000°C; it produces secondary mullite at approximately 1,250°C. Before mullite transfer, it appeared as metakaolinite at 680°C and, thereafter, amorphous at 800–900°C(Koh, 1992). Because the kaolinite was not detected and only mullite was observed, it is assumed that all samples were firing at the temperature above which the mullite was produced(Figure 6). Given that there is no significant difference in strength or shape of the peak, the raw materials and firing environments used appear to be similar. Therefore, the manufacturing technique of black ware presume to have been formalized.
3.5. Statistical analysis using component content
3.5.1. Major elements of body
The eigenvalues indicate the variance of each principal component. That of principal component 1 being the largest, at 3.08. It is meaning to having approximately 3.08 times the amount of information compared to the variance of standardized data, 1. The eigenvalues of principal components 5, 6, and 7 do not exceed 0.5, it signify that a small the amount of information required is small. The rates of variance represent eigenvalues as a percentage of the total amount of information, and the cumulative rates refer to indicates the sum of the cumulative rates, from principal component 1 to itself n(Table 2). The variance rate for principal component 1 is 43.99% and that for principal component 2 is 20.25%. The rate for the total data is 64.23%.
The data provided in Table 3 can be used to understand the relationship between the principal components 1 and 2 for each variable. In the principal component 1, SiO2 is inversely proportional -0.54 and Al2O3 is proportional 0.49. These two compounds have the most significant effect on principal component 1. Among principal components 2, MnO, CaO, and FeO are significant, with eigenvectors 0.68, -0.47, and 0.46, respectively.
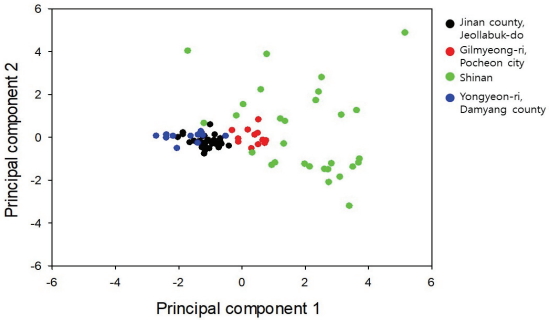
Figure 7 is a distribution graph for principal components 1 and 2 with respect to the excavated site. As the Damyang Yongyeon-ri and Bonggok kiln sites in Jinan-gun are similar distribution on the graph and the Shinan shipwreck has a different distribution, it is assumed that because of the two kilns have a similar aspects in distribution, the raw materials used to make wares are similar. On the other hand, the Shinan shipwreck data show sporadic graph distributions compared to other data, apparently owing to the variation in the making places.
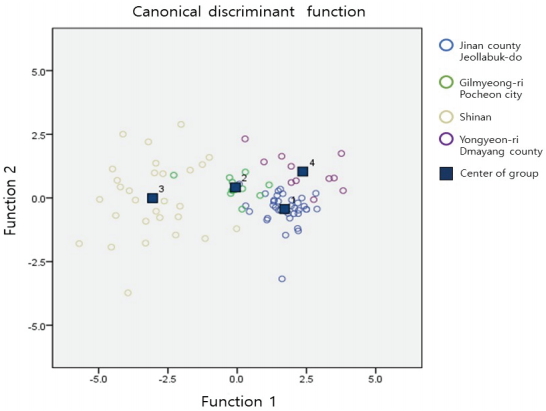
The discriminant analysis of the major components is shown in Figure 8 by comparing among the body compositions of black ware excavated from Damyang Yongyeon-ri, Gilmyeong-ri Pocheon-si(Koh and Kim, 2008), Bonggok kiln site in Jinan-gun(Park and Chung, 2016), and the Shinan shipwreck(Park et al., 2019). It is difficult to classify the data of each excavated site, and the center and shape of the multivariate normal distribution of the measured values overlap. As with the principal component analysis, it is difficult to distinguish among black ware by excavated site.
3.5.2. Major elements of glaze
It has a higher the amount of information compressed than the body’s 64.23%. It seems that variables compressed into principal components 1 and 2 contain more information than the body(Table 4).
Table 5 provides data related to the influence of principal components 1 and 2 on the glaze layer. Further, in Figure 9, each samples are placed on the principal components analysis. FeO and Al2O3 have a significant impact on principal component 1, and SiO2 and K2O have a impact on principal component 2. Graph characteristics with remarkable distinctions according to the excavation sites can be clearly seen in the principal component analysis graph of the glaze rather than that of the body. The reason for this is that there is a difference in the amount of FeO, Al2O3, and K2O compared to the SiO2 content in the glaze used at each kiln. The composition of the glaze used in the kilns are distinguished by the content of FeO and K2O. In particular, the content of iron oxides is closely related to the extent of coloration of the black ware. Therefore, the composition difference about excavation site can be related to the characteristics of the black ware.
Further, that the amount of CaO in principal component 2 has an influence as next major factor to the amount of K2O in principal component 2, which can be seen as impacting the analysis of principal components owing to the effects of materials such as limestone(Park, 2015).
The discriminant analysis using the major components is shown in Figure 10. That is comparing the samples obtained at the sites of Damyang Yongyeon-ri, Gilmyeong-ri Pocheon-si (Koh and Kim, 2008), Bonggok kiln site in Jinan-gun(Park and Chung, 2016), and the Shinan shipwreck(Park et al., 2019).
Table 6 provides the result of the EDS analysis of the ceramics. The FeO data were used for principal component analysis and the amount of Fe2O3 was calculated and applied for discriminant analysis.
3.5.3. Minor elements of body and glaze
Analysis through minor elements is possible when the following two conditions are met: The first should be that the porcelain was made using raw materials near the excavated area. Second, the geological environment of the site must have a clearly different characteristics(Kang, 1997).
In this study, a total of seven samples(DY-4, DY-6, DY-7, DY-9, DY-10, DY-12, DY-13) were analyzed for content of the minor elements. Although the cumulative rate of principal component 2(Table 7) is approximately 78%, from Table 8, it is clear that no factor has an effect greater than 0.5 on the principal components 1 and 2. This refers to the difficulty in distinguishing samples by analyzing the minor elements, and that is, when judged based on the discriminant analysis result using minor elements, each sample excavated from Damyang Yongyeon-ri has a special correlation with each other.
The minor elements data through inductively coupled plasma analysis will require a comparative statistical analysis process in the future, combined with the other derived black wares’ minor element data.
The minor element data used for principal component analysis are provided in Table 9.
4. CONCLUSIONS
The characteristics of black ware, excavated from the Damyang Yongyeon-ri kiln, were investigated in a scientific way. These characteristics were studied and compared to the characteristics of black ware excavated from Gilmyeong-ri Pocheon-si, Bonggok kiln site in Jinan-gun, and the Shinan shipwreck, where previous studies have been conducted. This is to find out how the black ware identified at different excavation sites differs in terms of material and manufacturing technology, and also to study if the characteristics and factors can be scientifically and objectively would presented the data.
The X-ray diffraction analysis of the excavated black ware from Damyang Yongyeon-ri identified only mullite. As no quartz and kaolinite were found, the reason for this is that it is assumed to have been maintained for a long time in the environment of the temperature at which mullite is produced or to have been fired at a higher temperature in kiln.
The physical assessment was performed only in Damyang Yongyeon-ri black ware, and no measurement data for porcelain sherds excavated from the three sites to be compared were reported in the paper. Based on the chrominance measurement data of the bodies, black ware from Damyang Yongyeon-ri is identified that the variation color difference is little, and between these sherds were not related with the location determined by the X-ray diffraction analysis. This is presumably because these porcelains were manufactured in a similar firing environment. But in general, the colors of the bodies of the black ware change proportionally in the direction of red-yellow as the firing temperature increases and then turn towards green-blue from 970°C(Han, 2006). The sherds DY-1 and DY-2 are located in a relatively red-yellow direction, absorption and apparent porosity are higher than others. This indicates that these sherds are likely to have been produced in a relatively low-temperature environment compared to other excavated ware. Nevertheless, the absorption and apparent porosity of some sherds fall within the range of physical values that common ceramics possess, and are similar when compared to celadon and white porcelain wares excavated together(Institute of Nation’s Cultural Heritage, 2018). This phenomenon is thought to be the difference in micro firing environment inside the kiln.
Optical microscope analysis any iron oxide crystals were not observed as compared to other excavated black ware, and the scanning electron microscope did not reveal the acicular structure, dendritic structure, or coagulation patterns of iron oxide. On the other hand, various iron oxide crystals were well observed in the black ware excavated from the Bonggok kiln site in Jinan-gun; its some sherds also had the same type of glaze layer as the black ware excavated from Damyang Yongyeon-ri. Upon comparison of the ingredients, the Bonggok kiln site appeared to be composed of plenty of iron oxide, the coloring agent, and to be uniform iron distributed state compared to sherds excavated from the other sites. In addition, the content ratio of potassium and calcium seems to influence crystallization of the metallic texture, which is presumed to be due to the raw material used to make the glaze at the time of manufacture.
Comparing the chemical components of the black ware by excavated sites using the principal component analysis, the amounts of SiO2, Al2O3, MnO, CaO, and Fe2O3 in the body and those of Fe2O3, Al2O3, SiO2, and K2O in the glaze were identified to be the most significant. Based on the results of the discriminant analysis, it may be difficult to distinguish between different types of excavation sites using components of body, but it is possible in the glaze layer. The results of the principal component analysis also indicate that the amount of Fe2O3, which is used as a coloring agent, varies significantly in the glaze. In addition, the amount of K2O also affects the classification of components for each sites, which can be considered in relation to the additive materials. However, further studies are required in this direction.
Therefore, scientific analysis shows that the color of black ware found in different excavation varies materialistically based on the conditions of color formation and the firing environment. It is expected that the objective and scientific interpretation of the manufacturing technique of black-glaze production by age and region will be possible in the future if the correlation among excavated black ware is studied by reproducing experiments on the various black-glaze colorants.