3.1. Damage condition
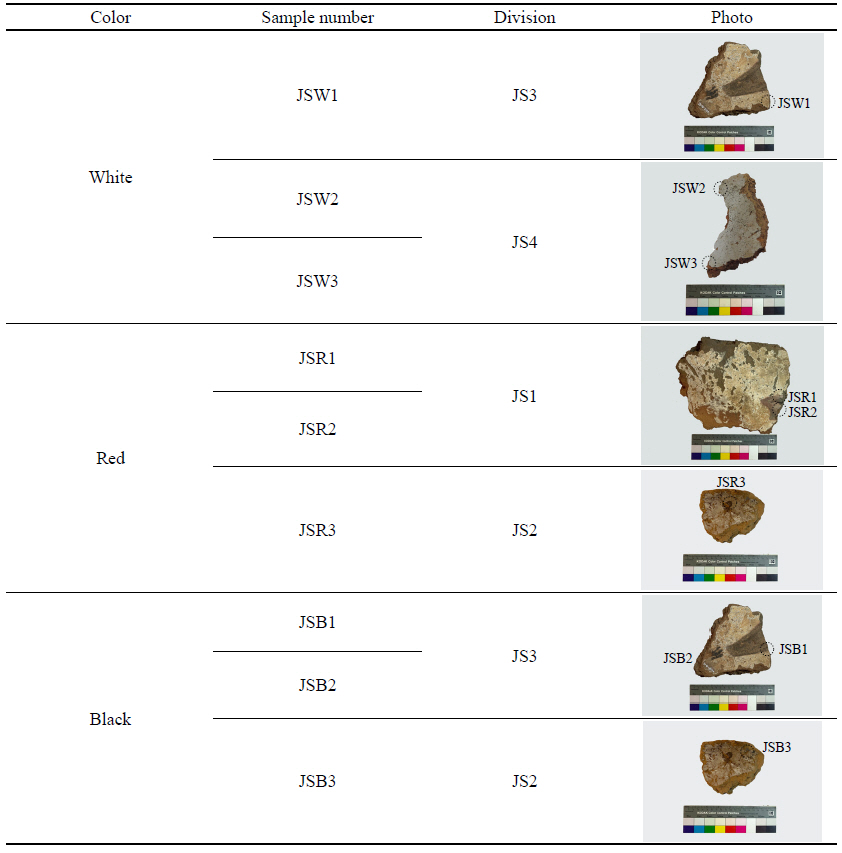
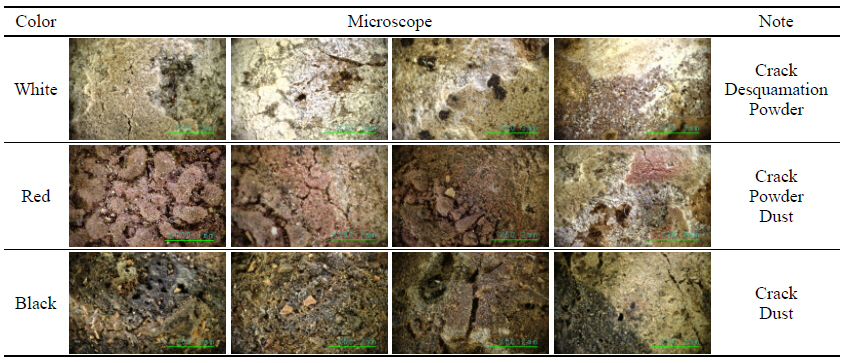
The wall painting, which was broken up and buried at the time of the fire that destroyed the original Jeseoksa temple, was excavated in the form of diverse fragments of varying shapes and sizes, covered with foreign substances such as soil. In addition, some of the wall fragments exhibited burn marks. White pigment wash was observed on most of the fragments, while some pieces showed traces of coloring in addition to the white pigment wash. Though it was difficult to ascertain the exact nature or appearance of the images solely from these fragments, a visual inspection revealed that main colors of the images were red and black. On the basis of the colors identified at the time of the visual inspection, the surfaces with red, black and white colored layers were subjected to an examination by portable microscope(Table
2).
Table 2
Microscope images for sample surface
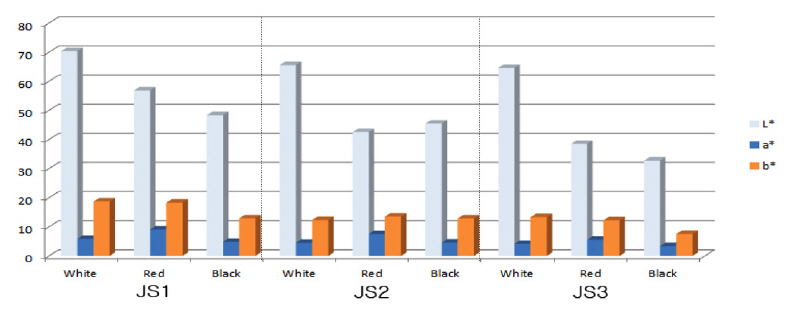
The results of this examination showed that surface cracking and peeling were progressing continuously, along with pulverization of the pigments. In addition, the presence of organic substances such as plant roots was observed. As regards JS1, differences in lightness were additionally measured as its white pigment was in relatively better condition. In terms of the lightness of the white pigment, JS1 was lightest, whereas JS2, JS3 were relatively darker. The color difference values for the red and black pigments were similar. The value for black was relatively darker which means that the a
*, b
* value was closer to a negative value(-), and the black pigment of JS3 was confirmed to be the closest to black. For the red pigment, JS1 was the lightest while JS3 was the darkest(Table
3, Figure
2).
Table 3
Chrominance list(L*a*b*) for sample surface
Figure 2
Chrominance graph for pigment of sample surface.
3.2. Component analysis of pigment
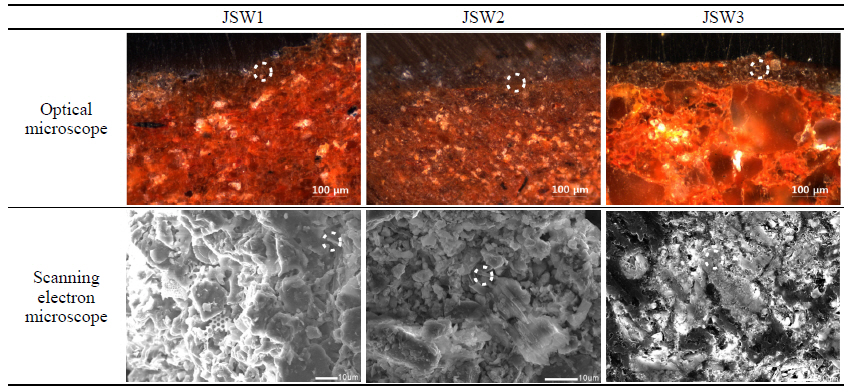
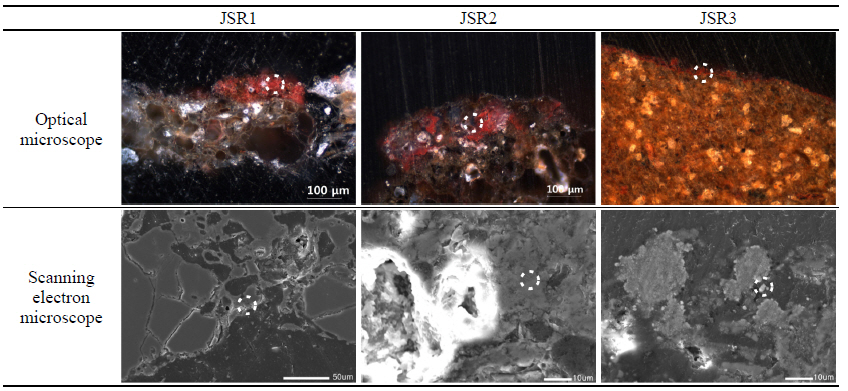
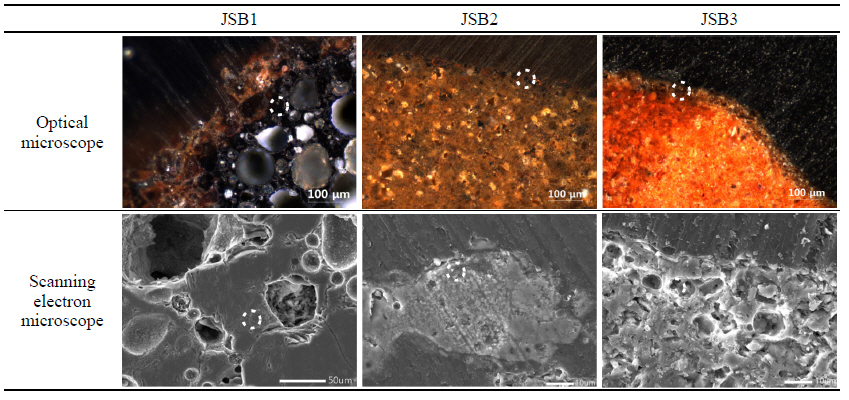
To analyze the pigment of the main wall, the microstructure of nine fragments(3 white, 3 black, and 3 red) were observed using an optical microscope and a scanning electron microscope. After Cross-sectional research through microscope, it is colored using pigments on the wall that is made through mixing the organic matter like straws and fibers and clay mineral. Clay mineral used for making the face of wall and the size of pigments’ particle is not mild but the particle of clay mineral is more close to the layer of coloring, higher the ratio of fine particles is. So, the layer between coloring and clay mineral is obvious. The results of this examination showed that all nine samples were composed of mud-plastered wall body and thin layers of color. The mud-plastered wall body was made up of red brown soil, distributed with grains of many different sizes. For the white sample group of JSW, the color was dark grey, which is less bright than white. In the red sample group, JSR1 and JSR2 were red overall, but partially mixed with white, and though the white color was distributed at a deeper position, the position of color layers was not clearly distinguished. For the black sample group of JSB, JSB2 and JSB3(but not JSB1), it was confirmed that there was no boundary between the red and black colors. In the case of JSB1, only black pigment was confirmed(Table
6).
The white sample group of JSW was analyzed using an energy dispersive X-ray spectrometer(Table
4), the results of which showed that all the samples contained Na, Al, Si, K and Fe, with Mg partially existent. A very small amount of Mg was detected, which indicates that it was part of the impurities contained in soil. The main contents of all three samples were Al(17~23%) and Si(20~24%), so they are considered to be the main components(Table
7, Figure
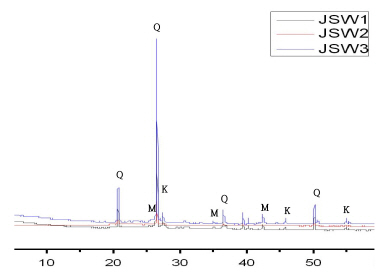
3). The results of X-ray diffractometry showed that both quartz (SiO
2) and alkali feldspar were present in all the samples. On the other hand, samples JSW1 and JSW2 were confirmed to contain hematite(Fe
2O
3) and plagioclase(NaAlSi
3O
8), while JSW2 and JSW3 contained mullite(3Al
2O
3·2SiO
2) (Figure
4).
Table 4
Optical microscope image, SEM image list for pigment of sample surface(JSW)
Figure 3
EDS analysis results graph for pigment of sample surface.
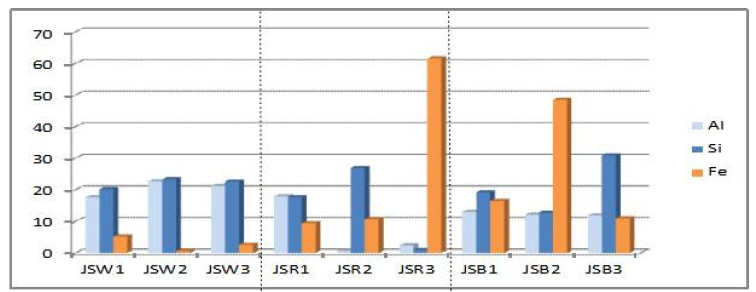
Figure 4
XRD analysis results graph for pigment of sample surface (Q: quartz. K: alkali feldspar, M: mullite).
The results of the analysis using an energy dispersive X-ray spectrometer(Table
5) of the red sample group of JSR showed that Al, Si and Fe were present in all of the samples, and that Na, Mg, Ca and Ti were present in small quantities. Among these, the Al, Si and Fe contents were high, and all three samples had a high Fe content. For JSR1 and JSR2, the Fe content was 9~11%, whereas JSR3 contained 61.62%, which suggests that Fe is its main component(Table
7, Figure
3). Table
6
Table 5
Optical microscope image, SEM image list for pigment of sample surface(JSR)
Table 6
Optical microscope image, SEM image list for pigment of sample surface(JSB)
As a result of X-ray diffractometry, all of the samples were confirmed to contain quartz(SiO
2), hematite and plagioclase(NaAlSi
3O
8), while samples JSR1 and JSR2 also contained mullite(3Al
2O
3·2SiO
2)(Figure
5).
Figure 5
XRD analysis results graph for pigment of sample surface (Q: quartz. K: alkali feldspar, M: mullite, H: hematite, Mg: magnetite, P: plagioclase).

The results of the analysis, using an energy dispersive X-ray spectrometer(Table
6), of black sample group of JB showed that all of the samples contained Al, Si, K and Fe, i.e. 11~14%, 12~31% and 10~49%, respectively, suggesting that these were the main components. In addition, some samples were found to contain Ti and Mn. The very small amounts of these elements found in some samples are believed to be part of soil impurities(Table
7, Figure
3). X-ray diffractometry showed that the samples contained quartz(SiO
2), magnetite, plagioclase(NaAlSi
3O
8) and alkali feldspar(Figure
6).
Figure 6
XRD analysis results graph for pigment of sample surface (Q: quartz. K: alkali feldspar, M: mullite, Mg: magnetite, P: plagioclase).
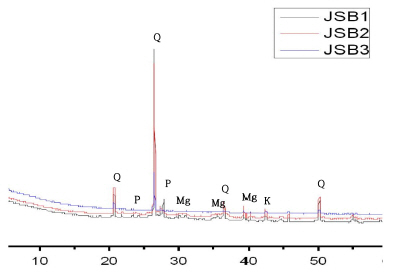
Table 7
EDS analysis results(all result in weight, %) for pigment of sample surface


